29
/
en
AIzaSyAYiBZKx7MnpbEhh9jyipgxe19OcubqV5w
April 1, 2024
83085
Belize
BLZ
true
2
1
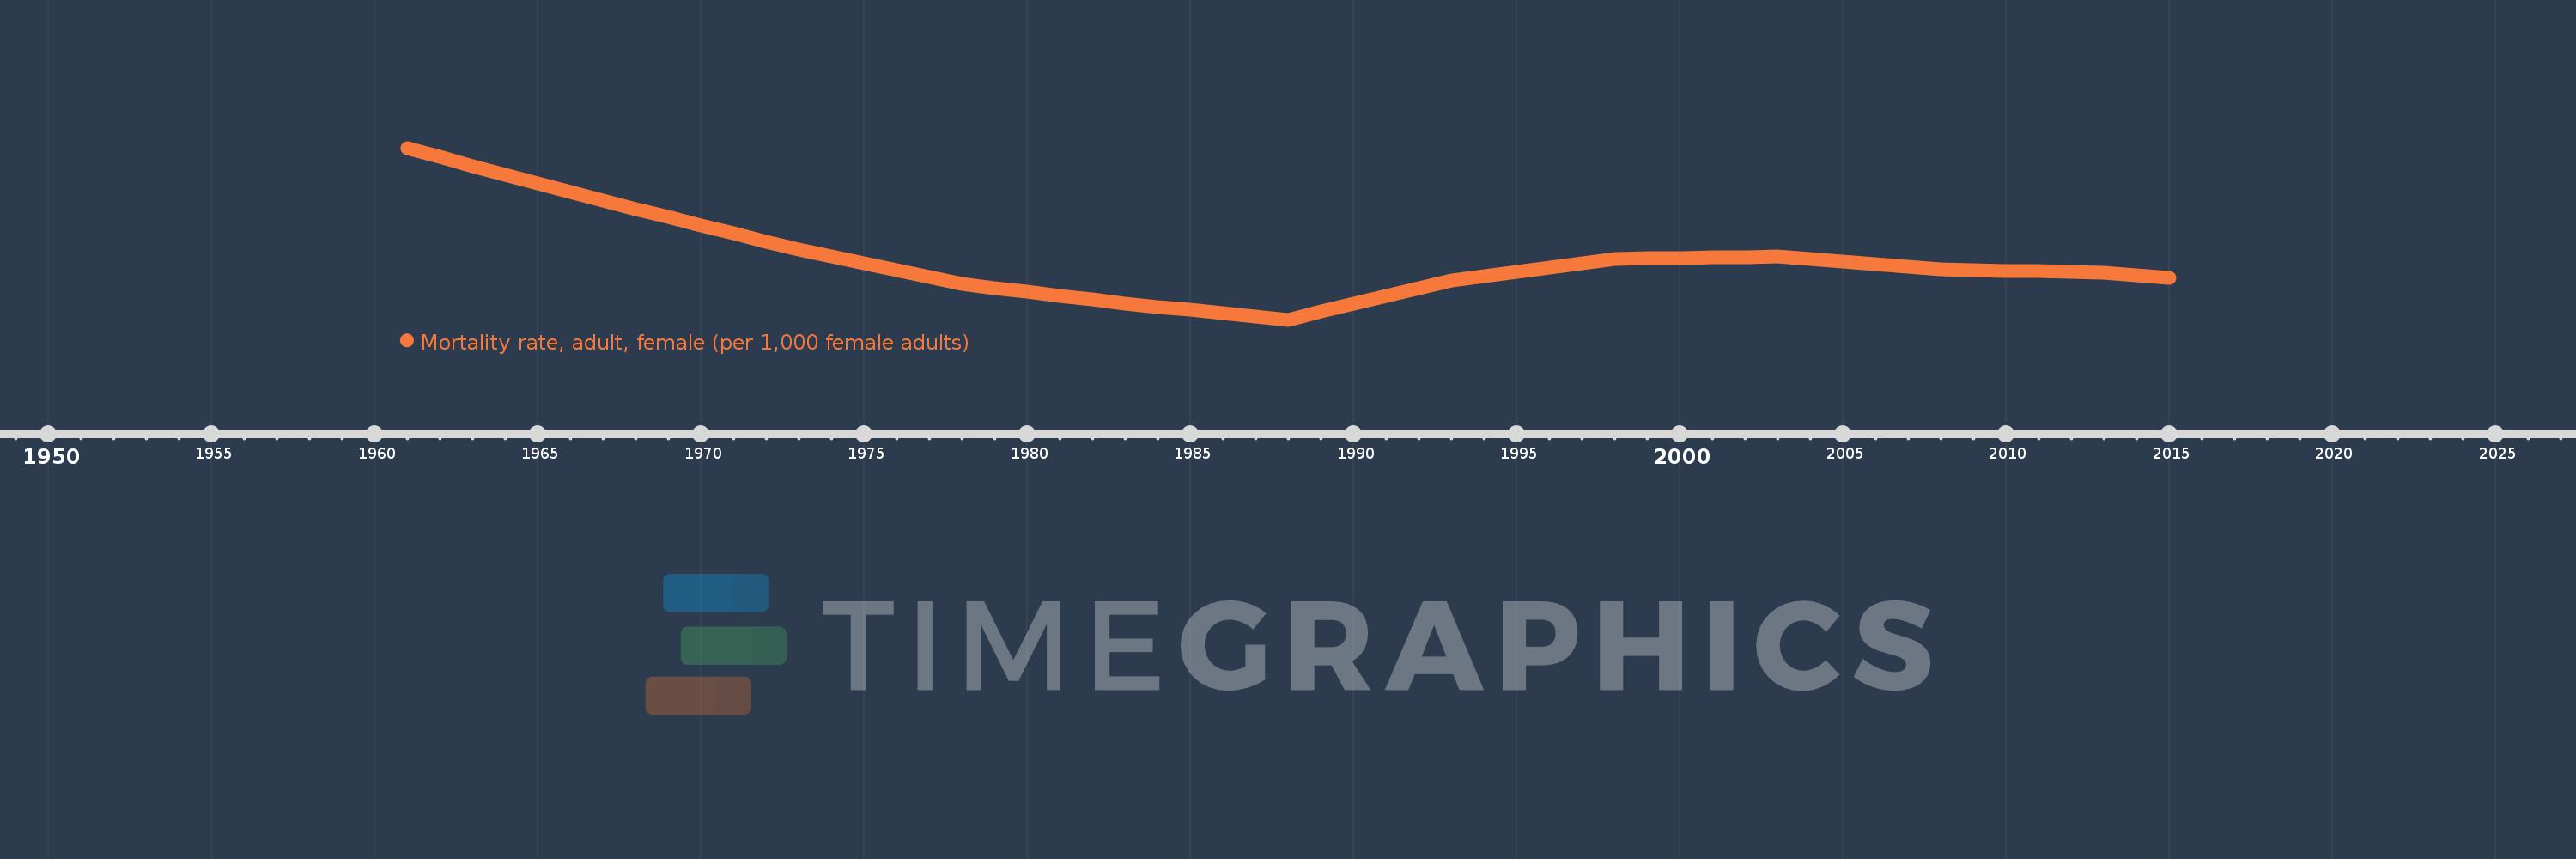
Mortality rate, adult, female (per 1,000 female adults)
2015,2014,2013,2012,2011,2010,2009,2008,2007,2006,2005,2004,2003,2002,2001,2000,1999,1998,1997,1996,1995,1994,1993,1992,1991,1990,1989,1988,1987,1986,1985,1984,1983,1982,1981,1980,1979,1978,1977,1976,1975,1974,1973,1972,1971,1970,1969,1968,1967,1966,1965,1964,1963,1962,1961
This statistics in other country:
AfghanistanAlbaniaAlgeriaAngolaAntigua and BarbudaArab WorldArgentinaArmeniaArubaAustraliaAustriaAzerbaijanBahamas, TheBahrainBangladeshBarbadosBelarusBelgiumBelizeBeninBhutanBoliviaBosnia and HerzegovinaBotswanaBrazilBrunei DarussalamBulgariaBurkina FasoBurundiCabo VerdeCambodiaCameroonCanadaCaribbean small statesCentral African RepublicCentral Europe and the BalticsChadChannel IslandsChileChinaColombiaComorosCongo, Dem. Rep.Congo, Rep.Costa RicaCote d'IvoireCroatiaCubaCuracaoCyprusCzech RepublicDenmarkDjiboutiDominicaDominican RepublicEarly-demographic dividendEast Asia & PacificEast Asia & Pacific (excluding high income)East Asia & Pacific (IDA & IBRD countries)EcuadorEgypt, Arab Rep.El SalvadorEquatorial GuineaEritreaEstoniaEthiopiaEuro areaEurope & Central AsiaEurope & Central Asia (excluding high income)Europe & Central Asia (IDA & IBRD countries)European UnionFijiFinlandFragile and conflict affected situationsFranceFrench PolynesiaGabonGambia, TheGeorgiaGermanyGhanaGreeceGreenlandGrenadaGuamGuatemalaGuineaGuinea-BissauGuyanaHaitiHeavily indebted poor countries (HIPC)High incomeHondurasHong Kong SAR, ChinaHungaryIBRD onlyIcelandIDA & IBRD totalIDA blendIDA onlyIDA totalIndiaIndonesiaIran, Islamic Rep.IraqIrelandIsraelItalyJamaicaJapanJordanKazakhstanKenyaKiribatiKorea, Dem. People’s Rep.Korea, Rep.KuwaitKyrgyz RepublicLao PDRLate-demographic dividendLatin America & Caribbean Latin America & Caribbean (excluding high income)Latin America & the Caribbean (IDA & IBRD countries)LatviaLeast developed countries: UN classificationLebanonLesothoLiberiaLibyaLithuaniaLow & middle incomeLow incomeLower middle incomeLuxembourgMacao SAR, ChinaMacedonia, FYRMadagascarMalawiMalaysiaMaldivesMaliMaltaMarshall IslandsMauritaniaMauritiusMexicoMicronesia, Fed. Sts.Middle East & North AfricaMiddle East & North Africa (excluding high income)Middle East & North Africa (IDA & IBRD countries)Middle incomeMoldovaMongoliaMontenegroMoroccoMozambiqueMyanmarNamibiaNepalNetherlandsNew CaledoniaNew ZealandNicaraguaNigerNigeriaNorth AmericaNorwayOECD membersOmanOther small statesPacific island small statesPakistanPanamaPapua New GuineaParaguayPeruPhilippinesPolandPortugalPost-demographic dividendPre-demographic dividendPuerto RicoQatarRomaniaRussian FederationRwandaSamoaSao Tome and PrincipeSaudi ArabiaSenegalSerbiaSeychellesSierra LeoneSingaporeSlovak RepublicSloveniaSmall statesSolomon IslandsSomaliaSouth AfricaSouth AsiaSouth Asia (IDA & IBRD)South SudanSpainSri LankaSt. Kitts and NevisSt. LuciaSt. Vincent and the GrenadinesSub-Saharan Africa Sub-Saharan Africa (excluding high income)Sub-Saharan Africa (IDA & IBRD countries)SudanSurinameSwazilandSwedenSwitzerlandSyrian Arab RepublicTajikistanTanzaniaThailandTimor-LesteTogoTongaTrinidad and TobagoTunisiaTurkeyTurkmenistanUgandaUkraineUnited Arab EmiratesUnited KingdomUnited StatesUpper middle incomeUruguayUzbekistanVanuatuVenezuela, RBVietnamVirgin Islands (U.S.)West Bank and GazaWorldYemen, Rep.ZambiaZimbabwe Timeline:
This timeline shows a graph from 1961 to 2015 of Belize. No data until 1960. Number of actual observations by date: 55.
Source name:
World Development Indicators
Source organization:
(1) United Nations Population Division. World Population Prospects. New York, United Nations, Department of Economic and Social Affairs (advanced Excel tables). Available at http://esa.un.org/wpp/unpp/panel_population.htm, (2) University of California, Berkeley, and Max Planck Institute for Demographic Research. Human Mortality Database. [ www.mortality.org or www.humanmortality.de].
Categories, topics:
Health, Gender
Last updated:
apr 23, 2017
Indicators value changes by year
Minimum:
103.569
jan 1, 1988
Maximum:
222.28
jan 1, 1961
At the date of observation
Value
Absolute change
Change from previous value
jan 1, 1961
222.28
+222.28
0.0%
jan 1, 1962
215.95
-6.33
-2.85%
jan 1, 1963
209.619
-6.331
-2.93%
jan 1, 1964
203.711
-5.908
-2.82%
jan 1, 1965
197.802
-5.909
-2.9%
jan 1, 1966
191.894
-5.908
-2.99%
jan 1, 1967
185.985
-5.909
-3.08%
jan 1, 1968
180.077
-5.908
-3.18%
jan 1, 1969
174.464
-5.613
-3.12%
jan 1, 1970
168.851
-5.613
-3.22%
jan 1, 1971
163.238
-5.613
-3.32%
jan 1, 1972
157.626
-5.612
-3.44%
jan 1, 1973
152.013
-5.613
-3.56%
jan 1, 1974
147.234
-4.779
-3.14%
jan 1, 1975
142.456
-4.778
-3.25%
jan 1, 1976
137.677
-4.779
-3.35%
jan 1, 1977
132.899
-4.778
-3.47%
jan 1, 1978
128.121
-4.778
-3.6%
jan 1, 1979
125.452
-2.669
-2.08%
jan 1, 1980
122.784
-2.668
-2.13%
jan 1, 1981
120.116
-2.668
-2.17%
jan 1, 1982
117.448
-2.668
-2.22%
jan 1, 1983
114.78
-2.668
-2.27%
jan 1, 1984
112.538
-2.242
-1.95%
jan 1, 1985
110.295
-2.243
-1.99%
jan 1, 1986
108.053
-2.242
-2.03%
jan 1, 1987
105.811
-2.242
-2.07%
jan 1, 1988
103.569
-2.242
-2.12%
jan 1, 1989
109.037
+5.468
5.28%
jan 1, 1990
114.506
+5.469
5.02%
jan 1, 1991
119.975
+5.469
4.78%
jan 1, 1992
125.444
+5.469
4.56%
jan 1, 1993
130.913
+5.469
4.36%
jan 1, 1994
133.848
+2.935
2.24%
jan 1, 1995
136.784
+2.936
2.19%
jan 1, 1996
139.719
+2.935
2.15%
jan 1, 1997
142.655
+2.936
2.1%
jan 1, 1998
145.59
+2.935
2.06%
jan 1, 1999
145.916
+0.326
0.22%
jan 1, 2000
146.242
+0.326
0.22%
jan 1, 2001
146.568
+0.326
0.22%
jan 1, 2002
146.894
+0.326
0.22%
jan 1, 2003
147.22
+0.326
0.22%
jan 1, 2004
145.414
-1.806
-1.23%
jan 1, 2005
143.608
-1.806
-1.24%
jan 1, 2006
141.802
-1.806
-1.26%
jan 1, 2007
139.996
-1.806
-1.27%
jan 1, 2008
138.19
-1.806
-1.29%
jan 1, 2009
137.806
-0.384
-0.28%
jan 1, 2010
137.422
-0.384
-0.28%
jan 1, 2011
137.038
-0.384
-0.28%
jan 1, 2012
136.654
-0.384
-0.28%
jan 1, 2013
136.27
-0.384
-0.28%
jan 1, 2014
134.368
-1.902
-1.4%
jan 1, 2015
132.467
-1.901
-1.41%
Ranking of countries by current statistics by years


Comments: