29
/
en
AIzaSyAYiBZKx7MnpbEhh9jyipgxe19OcubqV5w
April 1, 2024
96415
Burundi
BDI
true
2
1
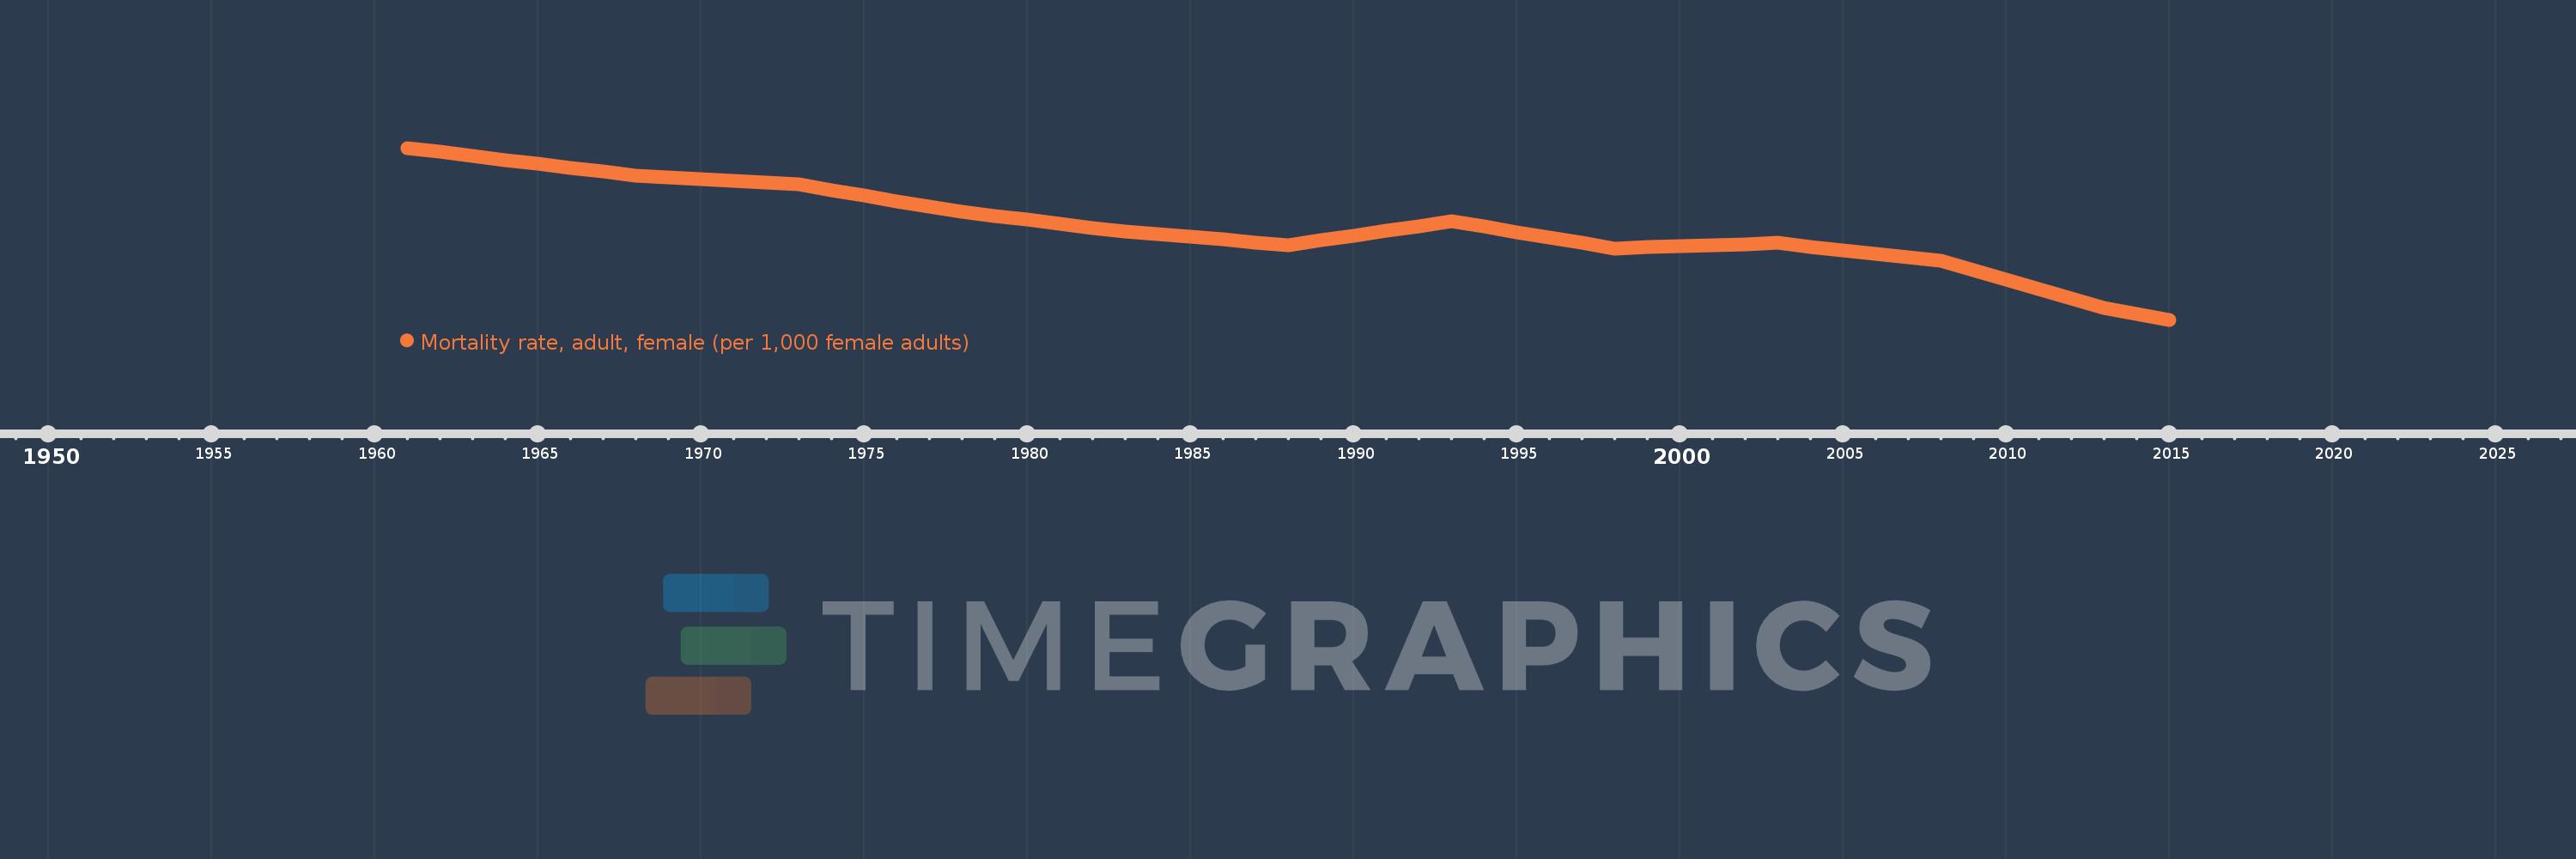
Mortality rate, adult, female (per 1,000 female adults)
2015,2014,2013,2012,2011,2010,2009,2008,2007,2006,2005,2004,2003,2002,2001,2000,1999,1998,1997,1996,1995,1994,1993,1992,1991,1990,1989,1988,1987,1986,1985,1984,1983,1982,1981,1980,1979,1978,1977,1976,1975,1974,1973,1972,1971,1970,1969,1968,1967,1966,1965,1964,1963,1962,1961
This statistics in other country:
AfghanistanAlbaniaAlgeriaAngolaAntigua and BarbudaArab WorldArgentinaArmeniaArubaAustraliaAustriaAzerbaijanBahamas, TheBahrainBangladeshBarbadosBelarusBelgiumBelizeBeninBhutanBoliviaBosnia and HerzegovinaBotswanaBrazilBrunei DarussalamBulgariaBurkina FasoBurundiCabo VerdeCambodiaCameroonCanadaCaribbean small statesCentral African RepublicCentral Europe and the BalticsChadChannel IslandsChileChinaColombiaComorosCongo, Dem. Rep.Congo, Rep.Costa RicaCote d'IvoireCroatiaCubaCuracaoCyprusCzech RepublicDenmarkDjiboutiDominicaDominican RepublicEarly-demographic dividendEast Asia & PacificEast Asia & Pacific (excluding high income)East Asia & Pacific (IDA & IBRD countries)EcuadorEgypt, Arab Rep.El SalvadorEquatorial GuineaEritreaEstoniaEthiopiaEuro areaEurope & Central AsiaEurope & Central Asia (excluding high income)Europe & Central Asia (IDA & IBRD countries)European UnionFijiFinlandFragile and conflict affected situationsFranceFrench PolynesiaGabonGambia, TheGeorgiaGermanyGhanaGreeceGreenlandGrenadaGuamGuatemalaGuineaGuinea-BissauGuyanaHaitiHeavily indebted poor countries (HIPC)High incomeHondurasHong Kong SAR, ChinaHungaryIBRD onlyIcelandIDA & IBRD totalIDA blendIDA onlyIDA totalIndiaIndonesiaIran, Islamic Rep.IraqIrelandIsraelItalyJamaicaJapanJordanKazakhstanKenyaKiribatiKorea, Dem. People’s Rep.Korea, Rep.KuwaitKyrgyz RepublicLao PDRLate-demographic dividendLatin America & Caribbean Latin America & Caribbean (excluding high income)Latin America & the Caribbean (IDA & IBRD countries)LatviaLeast developed countries: UN classificationLebanonLesothoLiberiaLibyaLithuaniaLow & middle incomeLow incomeLower middle incomeLuxembourgMacao SAR, ChinaMacedonia, FYRMadagascarMalawiMalaysiaMaldivesMaliMaltaMarshall IslandsMauritaniaMauritiusMexicoMicronesia, Fed. Sts.Middle East & North AfricaMiddle East & North Africa (excluding high income)Middle East & North Africa (IDA & IBRD countries)Middle incomeMoldovaMongoliaMontenegroMoroccoMozambiqueMyanmarNamibiaNepalNetherlandsNew CaledoniaNew ZealandNicaraguaNigerNigeriaNorth AmericaNorwayOECD membersOmanOther small statesPacific island small statesPakistanPanamaPapua New GuineaParaguayPeruPhilippinesPolandPortugalPost-demographic dividendPre-demographic dividendPuerto RicoQatarRomaniaRussian FederationRwandaSamoaSao Tome and PrincipeSaudi ArabiaSenegalSerbiaSeychellesSierra LeoneSingaporeSlovak RepublicSloveniaSmall statesSolomon IslandsSomaliaSouth AfricaSouth AsiaSouth Asia (IDA & IBRD)South SudanSpainSri LankaSt. Kitts and NevisSt. LuciaSt. Vincent and the GrenadinesSub-Saharan Africa Sub-Saharan Africa (excluding high income)Sub-Saharan Africa (IDA & IBRD countries)SudanSurinameSwazilandSwedenSwitzerlandSyrian Arab RepublicTajikistanTanzaniaThailandTimor-LesteTogoTongaTrinidad and TobagoTunisiaTurkeyTurkmenistanUgandaUkraineUnited Arab EmiratesUnited KingdomUnited StatesUpper middle incomeUruguayUzbekistanVanuatuVenezuela, RBVietnamVirgin Islands (U.S.)West Bank and GazaWorldYemen, Rep.ZambiaZimbabwe Timeline:
This timeline shows a graph from 1961 to 2015 of Burundi. No data until 1960. Number of actual observations by date: 55.
Source name:
World Development Indicators
Source organization:
(1) United Nations Population Division. World Population Prospects. New York, United Nations, Department of Economic and Social Affairs (advanced Excel tables). Available at http://esa.un.org/wpp/unpp/panel_population.htm, (2) University of California, Berkeley, and Max Planck Institute for Demographic Research. Human Mortality Database. [ www.mortality.org or www.humanmortality.de].
Categories, topics:
Health, Gender
Last updated:
apr 23, 2017
Indicators value changes by year
Minimum:
267.069
jan 1, 2015
Maximum:
407.843
jan 1, 1961
At the date of observation
Value
Absolute change
Change from previous value
jan 1, 1961
407.843
+407.843
0.0%
jan 1, 1962
404.56
-3.283
-0.8%
jan 1, 1963
401.276
-3.284
-0.81%
jan 1, 1964
398.058
-3.218
-0.8%
jan 1, 1965
394.839
-3.219
-0.81%
jan 1, 1966
391.621
-3.218
-0.82%
jan 1, 1967
388.403
-3.218
-0.82%
jan 1, 1968
385.185
-3.218
-0.83%
jan 1, 1969
383.697
-1.488
-0.39%
jan 1, 1970
382.209
-1.488
-0.39%
jan 1, 1971
380.721
-1.488
-0.39%
jan 1, 1972
379.233
-1.488
-0.39%
jan 1, 1973
377.745
-1.488
-0.39%
jan 1, 1974
373.269
-4.476
-1.18%
jan 1, 1975
368.793
-4.476
-1.2%
jan 1, 1976
364.317
-4.476
-1.21%
jan 1, 1977
359.841
-4.476
-1.23%
jan 1, 1978
355.365
-4.476
-1.24%
jan 1, 1979
352.128
-3.237
-0.91%
jan 1, 1980
348.891
-3.237
-0.92%
jan 1, 1981
345.654
-3.237
-0.93%
jan 1, 1982
342.417
-3.237
-0.94%
jan 1, 1983
339.18
-3.237
-0.95%
jan 1, 1984
337.022
-2.158
-0.64%
jan 1, 1985
334.863
-2.159
-0.64%
jan 1, 1986
332.705
-2.158
-0.64%
jan 1, 1987
330.546
-2.159
-0.65%
jan 1, 1988
328.388
-2.158
-0.65%
jan 1, 1989
332.267
+3.879
1.18%
jan 1, 1990
336.147
+3.88
1.17%
jan 1, 1991
340.026
+3.879
1.15%
jan 1, 1992
343.905
+3.879
1.14%
jan 1, 1993
347.785
+3.88
1.13%
jan 1, 1994
343.315
-4.47
-1.29%
jan 1, 1995
338.846
-4.469
-1.3%
jan 1, 1996
334.376
-4.47
-1.32%
jan 1, 1997
329.906
-4.47
-1.34%
jan 1, 1998
325.437
-4.469
-1.35%
jan 1, 1999
326.343
+0.906
0.28%
jan 1, 2000
327.248
+0.905
0.28%
jan 1, 2001
328.154
+0.906
0.28%
jan 1, 2002
329.06
+0.906
0.28%
jan 1, 2003
329.966
+0.906
0.28%
jan 1, 2004
327.0
-2.966
-0.9%
jan 1, 2005
324.034
-2.966
-0.91%
jan 1, 2006
321.068
-2.966
-0.92%
jan 1, 2007
318.103
-2.965
-0.92%
jan 1, 2008
315.137
-2.966
-0.93%
jan 1, 2009
307.511
-7.626
-2.42%
jan 1, 2010
299.885
-7.626
-2.48%
jan 1, 2011
292.259
-7.626
-2.54%
jan 1, 2012
284.633
-7.626
-2.61%
jan 1, 2013
277.007
-7.626
-2.68%
jan 1, 2014
272.038
-4.969
-1.79%
jan 1, 2015
267.069
-4.969
-1.83%
Ranking of countries by current statistics by years


Comments: