29
/
en
AIzaSyAYiBZKx7MnpbEhh9jyipgxe19OcubqV5w
April 1, 2024
209577
New Zealand
NZL
true
2
1
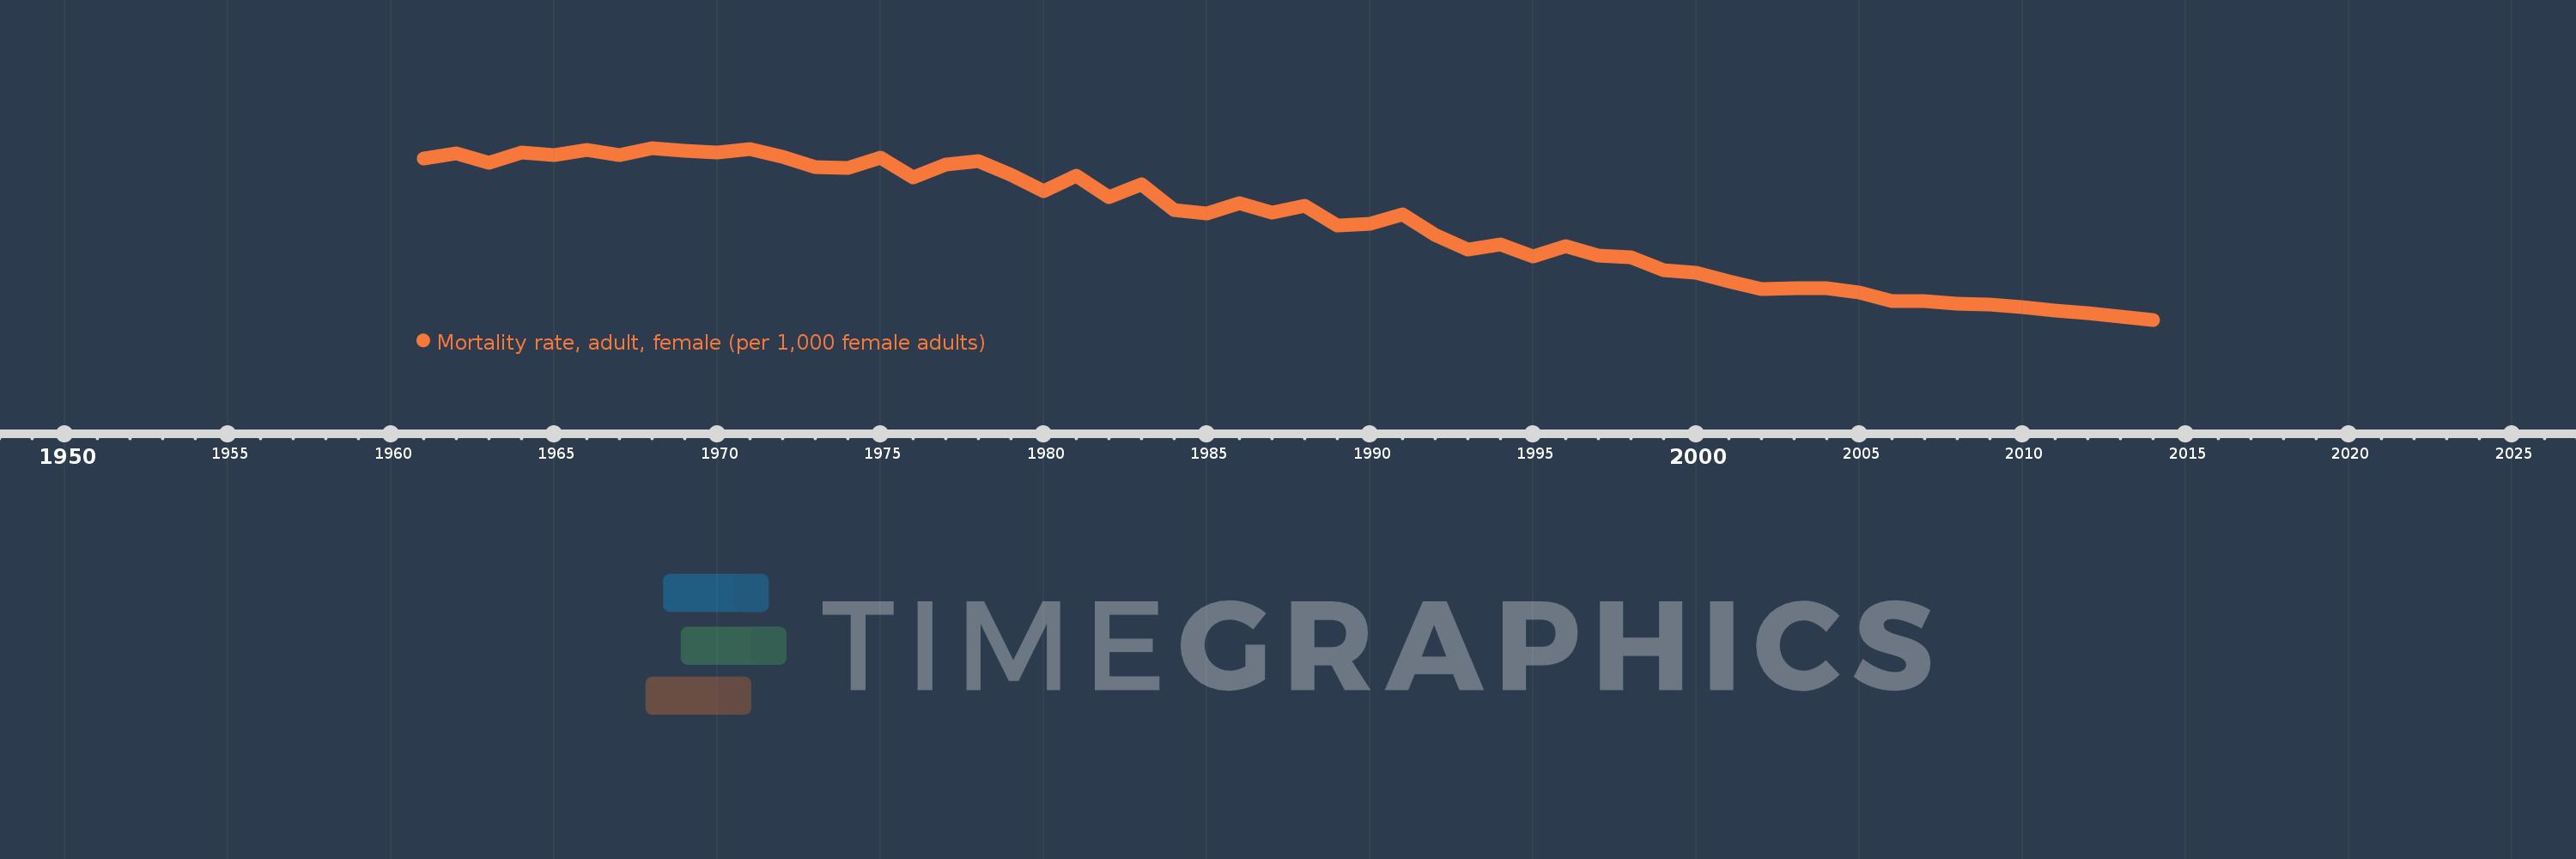
Mortality rate, adult, female (per 1,000 female adults)
2014,2013,2012,2011,2010,2009,2008,2007,2006,2005,2004,2003,2002,2001,2000,1999,1998,1997,1996,1995,1994,1993,1992,1991,1990,1989,1988,1987,1986,1985,1984,1983,1982,1981,1980,1979,1978,1977,1976,1975,1974,1973,1972,1971,1970,1969,1968,1967,1966,1965,1964,1963,1962,1961
This statistics in other country:
AfghanistanAlbaniaAlgeriaAngolaAntigua and BarbudaArab WorldArgentinaArmeniaArubaAustraliaAustriaAzerbaijanBahamas, TheBahrainBangladeshBarbadosBelarusBelgiumBelizeBeninBhutanBoliviaBosnia and HerzegovinaBotswanaBrazilBrunei DarussalamBulgariaBurkina FasoBurundiCabo VerdeCambodiaCameroonCanadaCaribbean small statesCentral African RepublicCentral Europe and the BalticsChadChannel IslandsChileChinaColombiaComorosCongo, Dem. Rep.Congo, Rep.Costa RicaCote d'IvoireCroatiaCubaCuracaoCyprusCzech RepublicDenmarkDjiboutiDominicaDominican RepublicEarly-demographic dividendEast Asia & PacificEast Asia & Pacific (excluding high income)East Asia & Pacific (IDA & IBRD countries)EcuadorEgypt, Arab Rep.El SalvadorEquatorial GuineaEritreaEstoniaEthiopiaEuro areaEurope & Central AsiaEurope & Central Asia (excluding high income)Europe & Central Asia (IDA & IBRD countries)European UnionFijiFinlandFragile and conflict affected situationsFranceFrench PolynesiaGabonGambia, TheGeorgiaGermanyGhanaGreeceGreenlandGrenadaGuamGuatemalaGuineaGuinea-BissauGuyanaHaitiHeavily indebted poor countries (HIPC)High incomeHondurasHong Kong SAR, ChinaHungaryIBRD onlyIcelandIDA & IBRD totalIDA blendIDA onlyIDA totalIndiaIndonesiaIran, Islamic Rep.IraqIrelandIsraelItalyJamaicaJapanJordanKazakhstanKenyaKiribatiKorea, Dem. People’s Rep.Korea, Rep.KuwaitKyrgyz RepublicLao PDRLate-demographic dividendLatin America & Caribbean Latin America & Caribbean (excluding high income)Latin America & the Caribbean (IDA & IBRD countries)LatviaLeast developed countries: UN classificationLebanonLesothoLiberiaLibyaLithuaniaLow & middle incomeLow incomeLower middle incomeLuxembourgMacao SAR, ChinaMacedonia, FYRMadagascarMalawiMalaysiaMaldivesMaliMaltaMarshall IslandsMauritaniaMauritiusMexicoMicronesia, Fed. Sts.Middle East & North AfricaMiddle East & North Africa (excluding high income)Middle East & North Africa (IDA & IBRD countries)Middle incomeMoldovaMongoliaMontenegroMoroccoMozambiqueMyanmarNamibiaNepalNetherlandsNew CaledoniaNew ZealandNicaraguaNigerNigeriaNorth AmericaNorwayOECD membersOmanOther small statesPacific island small statesPakistanPanamaPapua New GuineaParaguayPeruPhilippinesPolandPortugalPost-demographic dividendPre-demographic dividendPuerto RicoQatarRomaniaRussian FederationRwandaSamoaSao Tome and PrincipeSaudi ArabiaSenegalSerbiaSeychellesSierra LeoneSingaporeSlovak RepublicSloveniaSmall statesSolomon IslandsSomaliaSouth AfricaSouth AsiaSouth Asia (IDA & IBRD)South SudanSpainSri LankaSt. Kitts and NevisSt. LuciaSt. Vincent and the GrenadinesSub-Saharan Africa Sub-Saharan Africa (excluding high income)Sub-Saharan Africa (IDA & IBRD countries)SudanSurinameSwazilandSwedenSwitzerlandSyrian Arab RepublicTajikistanTanzaniaThailandTimor-LesteTogoTongaTrinidad and TobagoTunisiaTurkeyTurkmenistanUgandaUkraineUnited Arab EmiratesUnited KingdomUnited StatesUpper middle incomeUruguayUzbekistanVanuatuVenezuela, RBVietnamVirgin Islands (U.S.)West Bank and GazaWorldYemen, Rep.ZambiaZimbabwe Timeline:
This timeline shows a graph from 1961 to 2014 of New Zealand. No data until 1960. Number of actual observations by date: 54.
Source name:
World Development Indicators
Source organization:
(1) United Nations Population Division. World Population Prospects. New York, United Nations, Department of Economic and Social Affairs (advanced Excel tables). Available at http://esa.un.org/wpp/unpp/panel_population.htm, (2) University of California, Berkeley, and Max Planck Institute for Demographic Research. Human Mortality Database. [ www.mortality.org or www.humanmortality.de].
Categories, topics:
Health, Gender
Last updated:
apr 23, 2017
Indicators value changes by year
Maximum:
118.952
jan 1, 1968
At the date of observation
Value
Absolute change
Change from previous value
jan 1, 1961
114.699
+114.699
0.0%
jan 1, 1962
116.917
+2.218
1.93%
jan 1, 1963
113.193
-3.724
-3.19%
jan 1, 1964
117.033
+3.84
3.39%
jan 1, 1965
116.144
-0.889
-0.76%
jan 1, 1966
118.208
+2.064
1.78%
jan 1, 1967
116.087
-2.121
-1.79%
jan 1, 1968
118.952
+2.865
2.47%
jan 1, 1969
117.762
-1.19
-1.0%
jan 1, 1970
117.033
-0.729
-0.62%
jan 1, 1971
118.365
+1.332
1.14%
jan 1, 1972
115.526
-2.839
-2.4%
jan 1, 1973
111.657
-3.869
-3.35%
jan 1, 1974
111.065
-0.592
-0.53%
jan 1, 1975
115.163
+4.098
3.69%
jan 1, 1976
107.586
-7.577
-6.58%
jan 1, 1977
112.395
+4.809
4.47%
jan 1, 1978
113.946
+1.551
1.38%
jan 1, 1979
108.506
-5.44
-4.77%
jan 1, 1980
102.274
-6.232
-5.74%
jan 1, 1981
108.074
+5.8
5.67%
jan 1, 1982
99.828
-8.246
-7.63%
jan 1, 1983
104.97
+5.142
5.15%
jan 1, 1984
94.994
-9.976
-9.5%
jan 1, 1985
93.447
-1.547
-1.63%
jan 1, 1986
97.388
+3.941
4.22%
jan 1, 1987
93.883
-3.505
-3.6%
jan 1, 1988
96.595
+2.712
2.89%
jan 1, 1989
88.776
-7.819
-8.09%
jan 1, 1990
89.47
+0.694
0.78%
jan 1, 1991
93.143
+3.673
4.11%
jan 1, 1992
85.323
-7.82
-8.4%
jan 1, 1993
79.577
-5.746
-6.73%
jan 1, 1994
81.638
+2.061
2.59%
jan 1, 1995
76.834
-4.804
-5.88%
jan 1, 1996
80.836
+4.002
5.21%
jan 1, 1997
77.12
-3.716
-4.6%
jan 1, 1998
76.656
-0.464
-0.6%
jan 1, 1999
71.378
-5.278
-6.89%
jan 1, 2000
70.386
-0.992
-1.39%
jan 1, 2001
67.08
-3.306
-4.7%
jan 1, 2002
64.096
-2.984
-4.45%
jan 1, 2003
64.554
+0.458
0.71%
jan 1, 2004
64.7
+0.146
0.23%
jan 1, 2005
62.955
-1.745
-2.7%
jan 1, 2006
59.576
-3.379
-5.37%
jan 1, 2007
59.436
-0.14
-0.23%
jan 1, 2008
58.432
-1.004
-1.69%
jan 1, 2009
58.323
-0.109
-0.19%
jan 1, 2010
57.122
-1.201
-2.06%
jan 1, 2011
55.921
-1.201
-2.1%
jan 1, 2012
54.72
-1.201
-2.15%
jan 1, 2013
53.519
-1.201
-2.19%
jan 1, 2014
52.32
-1.199
-2.24%
Ranking of countries by current statistics by years


Comments: