29
/
en
AIzaSyAYiBZKx7MnpbEhh9jyipgxe19OcubqV5w
April 1, 2024
273902
Ukraine
UKR
true
2
1
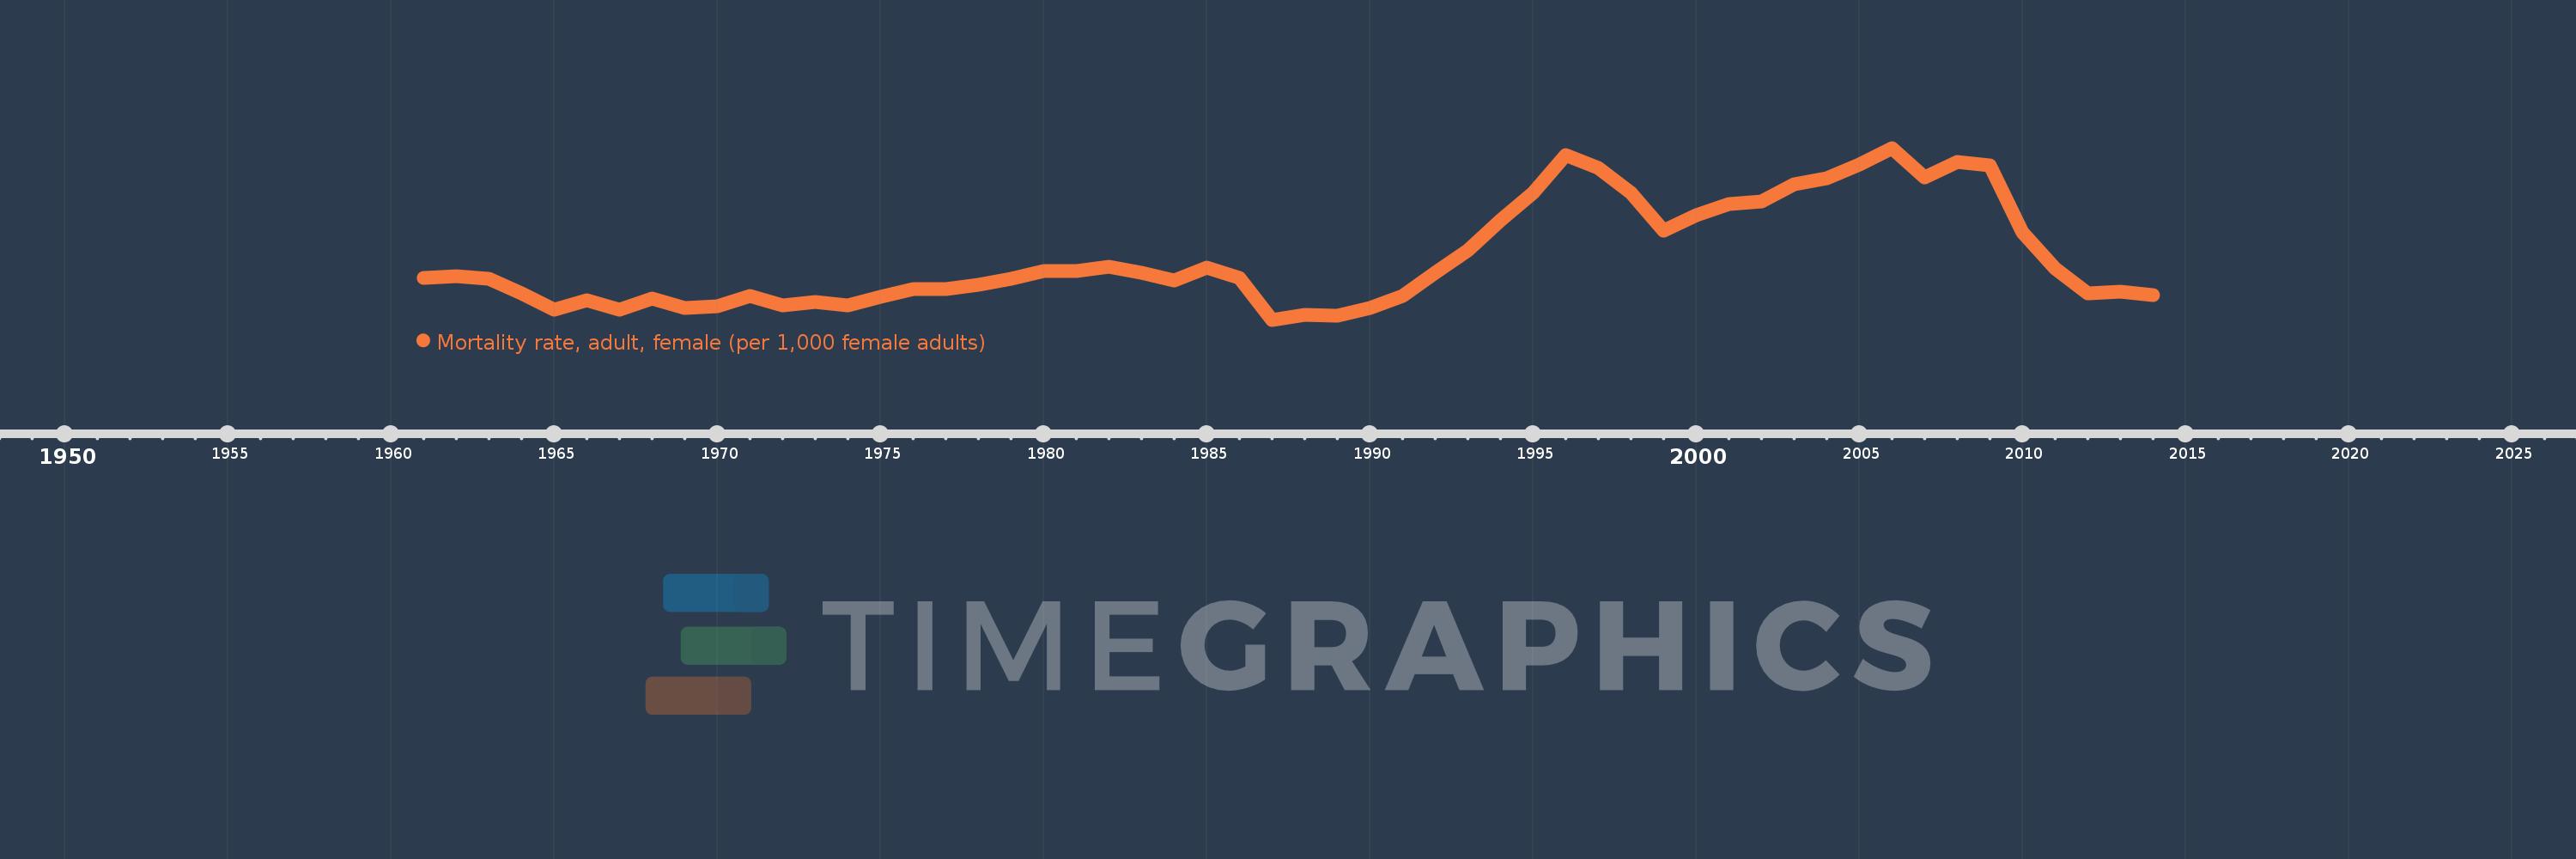
Mortality rate, adult, female (per 1,000 female adults)
2014,2013,2012,2011,2010,2009,2008,2007,2006,2005,2004,2003,2002,2001,2000,1999,1998,1997,1996,1995,1994,1993,1992,1991,1990,1989,1988,1987,1986,1985,1984,1983,1982,1981,1980,1979,1978,1977,1976,1975,1974,1973,1972,1971,1970,1969,1968,1967,1966,1965,1964,1963,1962,1961
This statistics in other country:
AfghanistanAlbaniaAlgeriaAngolaAntigua and BarbudaArab WorldArgentinaArmeniaArubaAustraliaAustriaAzerbaijanBahamas, TheBahrainBangladeshBarbadosBelarusBelgiumBelizeBeninBhutanBoliviaBosnia and HerzegovinaBotswanaBrazilBrunei DarussalamBulgariaBurkina FasoBurundiCabo VerdeCambodiaCameroonCanadaCaribbean small statesCentral African RepublicCentral Europe and the BalticsChadChannel IslandsChileChinaColombiaComorosCongo, Dem. Rep.Congo, Rep.Costa RicaCote d'IvoireCroatiaCubaCuracaoCyprusCzech RepublicDenmarkDjiboutiDominicaDominican RepublicEarly-demographic dividendEast Asia & PacificEast Asia & Pacific (excluding high income)East Asia & Pacific (IDA & IBRD countries)EcuadorEgypt, Arab Rep.El SalvadorEquatorial GuineaEritreaEstoniaEthiopiaEuro areaEurope & Central AsiaEurope & Central Asia (excluding high income)Europe & Central Asia (IDA & IBRD countries)European UnionFijiFinlandFragile and conflict affected situationsFranceFrench PolynesiaGabonGambia, TheGeorgiaGermanyGhanaGreeceGreenlandGrenadaGuamGuatemalaGuineaGuinea-BissauGuyanaHaitiHeavily indebted poor countries (HIPC)High incomeHondurasHong Kong SAR, ChinaHungaryIBRD onlyIcelandIDA & IBRD totalIDA blendIDA onlyIDA totalIndiaIndonesiaIran, Islamic Rep.IraqIrelandIsraelItalyJamaicaJapanJordanKazakhstanKenyaKiribatiKorea, Dem. People’s Rep.Korea, Rep.KuwaitKyrgyz RepublicLao PDRLate-demographic dividendLatin America & Caribbean Latin America & Caribbean (excluding high income)Latin America & the Caribbean (IDA & IBRD countries)LatviaLeast developed countries: UN classificationLebanonLesothoLiberiaLibyaLithuaniaLow & middle incomeLow incomeLower middle incomeLuxembourgMacao SAR, ChinaMacedonia, FYRMadagascarMalawiMalaysiaMaldivesMaliMaltaMarshall IslandsMauritaniaMauritiusMexicoMicronesia, Fed. Sts.Middle East & North AfricaMiddle East & North Africa (excluding high income)Middle East & North Africa (IDA & IBRD countries)Middle incomeMoldovaMongoliaMontenegroMoroccoMozambiqueMyanmarNamibiaNepalNetherlandsNew CaledoniaNew ZealandNicaraguaNigerNigeriaNorth AmericaNorwayOECD membersOmanOther small statesPacific island small statesPakistanPanamaPapua New GuineaParaguayPeruPhilippinesPolandPortugalPost-demographic dividendPre-demographic dividendPuerto RicoQatarRomaniaRussian FederationRwandaSamoaSao Tome and PrincipeSaudi ArabiaSenegalSerbiaSeychellesSierra LeoneSingaporeSlovak RepublicSloveniaSmall statesSolomon IslandsSomaliaSouth AfricaSouth AsiaSouth Asia (IDA & IBRD)South SudanSpainSri LankaSt. Kitts and NevisSt. LuciaSt. Vincent and the GrenadinesSub-Saharan Africa Sub-Saharan Africa (excluding high income)Sub-Saharan Africa (IDA & IBRD countries)SudanSurinameSwazilandSwedenSwitzerlandSyrian Arab RepublicTajikistanTanzaniaThailandTimor-LesteTogoTongaTrinidad and TobagoTunisiaTurkeyTurkmenistanUgandaUkraineUnited Arab EmiratesUnited KingdomUnited StatesUpper middle incomeUruguayUzbekistanVanuatuVenezuela, RBVietnamVirgin Islands (U.S.)West Bank and GazaWorldYemen, Rep.ZambiaZimbabwe Timeline:
This timeline shows a graph from 1961 to 2014 of Ukraine. No data until 1960. Number of actual observations by date: 54.
Source name:
World Development Indicators
Source organization:
(1) United Nations Population Division. World Population Prospects. New York, United Nations, Department of Economic and Social Affairs (advanced Excel tables). Available at http://esa.un.org/wpp/unpp/panel_population.htm, (2) University of California, Berkeley, and Max Planck Institute for Demographic Research. Human Mortality Database. [ www.mortality.org or www.humanmortality.de].
Categories, topics:
Health, Gender
Last updated:
apr 23, 2017
Indicators value changes by year
Minimum:
104.708
jan 1, 1987
Maximum:
150.234
jan 1, 2006
At the date of observation
Value
Absolute change
Change from previous value
jan 1, 1961
115.722
+115.722
0.0%
jan 1, 1962
116.152
+0.43
0.37%
jan 1, 1963
115.627
-0.525
-0.45%
jan 1, 1964
111.623
-4.004
-3.46%
jan 1, 1965
107.301
-4.322
-3.87%
jan 1, 1966
109.972
+2.671
2.49%
jan 1, 1967
107.301
-2.671
-2.43%
jan 1, 1968
110.26
+2.959
2.76%
jan 1, 1969
107.878
-2.382
-2.16%
jan 1, 1970
108.236
+0.358
0.33%
jan 1, 1971
111.064
+2.828
2.61%
jan 1, 1972
108.569
-2.495
-2.25%
jan 1, 1973
109.414
+0.845
0.78%
jan 1, 1974
108.433
-0.981
-0.9%
jan 1, 1975
110.677
+2.244
2.07%
jan 1, 1976
112.744
+2.067
1.87%
jan 1, 1977
112.757
+0.013
0.01%
jan 1, 1978
113.896
+1.139
1.01%
jan 1, 1979
115.566
+1.67
1.47%
jan 1, 1980
117.519
+1.953
1.69%
jan 1, 1981
117.705
+0.186
0.16%
jan 1, 1982
118.782
+1.077
0.91%
jan 1, 1983
117.206
-1.576
-1.33%
jan 1, 1984
114.997
-2.209
-1.88%
jan 1, 1985
118.532
+3.535
3.07%
jan 1, 1986
115.765
-2.767
-2.33%
jan 1, 1987
104.708
-11.057
-9.55%
jan 1, 1988
105.901
+1.193
1.14%
jan 1, 1989
105.831
-0.07
-0.07%
jan 1, 1990
107.816
+1.985
1.88%
jan 1, 1991
110.989
+3.173
2.94%
jan 1, 1992
117.115
+6.126
5.52%
jan 1, 1993
122.997
+5.882
5.02%
jan 1, 1994
131.076
+8.079
6.57%
jan 1, 1995
138.262
+7.186
5.48%
jan 1, 1996
148.33
+10.068
7.28%
jan 1, 1997
144.951
-3.379
-2.28%
jan 1, 1998
138.38
-6.571
-4.53%
jan 1, 1999
128.305
-10.075
-7.28%
jan 1, 2000
132.523
+4.218
3.29%
jan 1, 2001
135.345
+2.822
2.13%
jan 1, 2002
136.027
+0.682
0.5%
jan 1, 2003
140.492
+4.465
3.28%
jan 1, 2004
142.194
+1.702
1.21%
jan 1, 2005
145.846
+3.652
2.57%
jan 1, 2006
150.234
+4.388
3.01%
jan 1, 2007
142.458
-7.776
-5.18%
jan 1, 2008
146.582
+4.124
2.89%
jan 1, 2009
145.511
-1.071
-0.73%
jan 1, 2010
127.783
-17.728
-12.18%
jan 1, 2011
118.277
-9.506
-7.44%
jan 1, 2012
111.639
-6.638
-5.61%
jan 1, 2013
112.067
+0.428
0.38%
jan 1, 2014
111.315
-0.752
-0.67%
Ranking of countries by current statistics by years


Comments: