29
/
en
AIzaSyAYiBZKx7MnpbEhh9jyipgxe19OcubqV5w
April 1, 2024
167808
Kenya
KEN
true
2
1
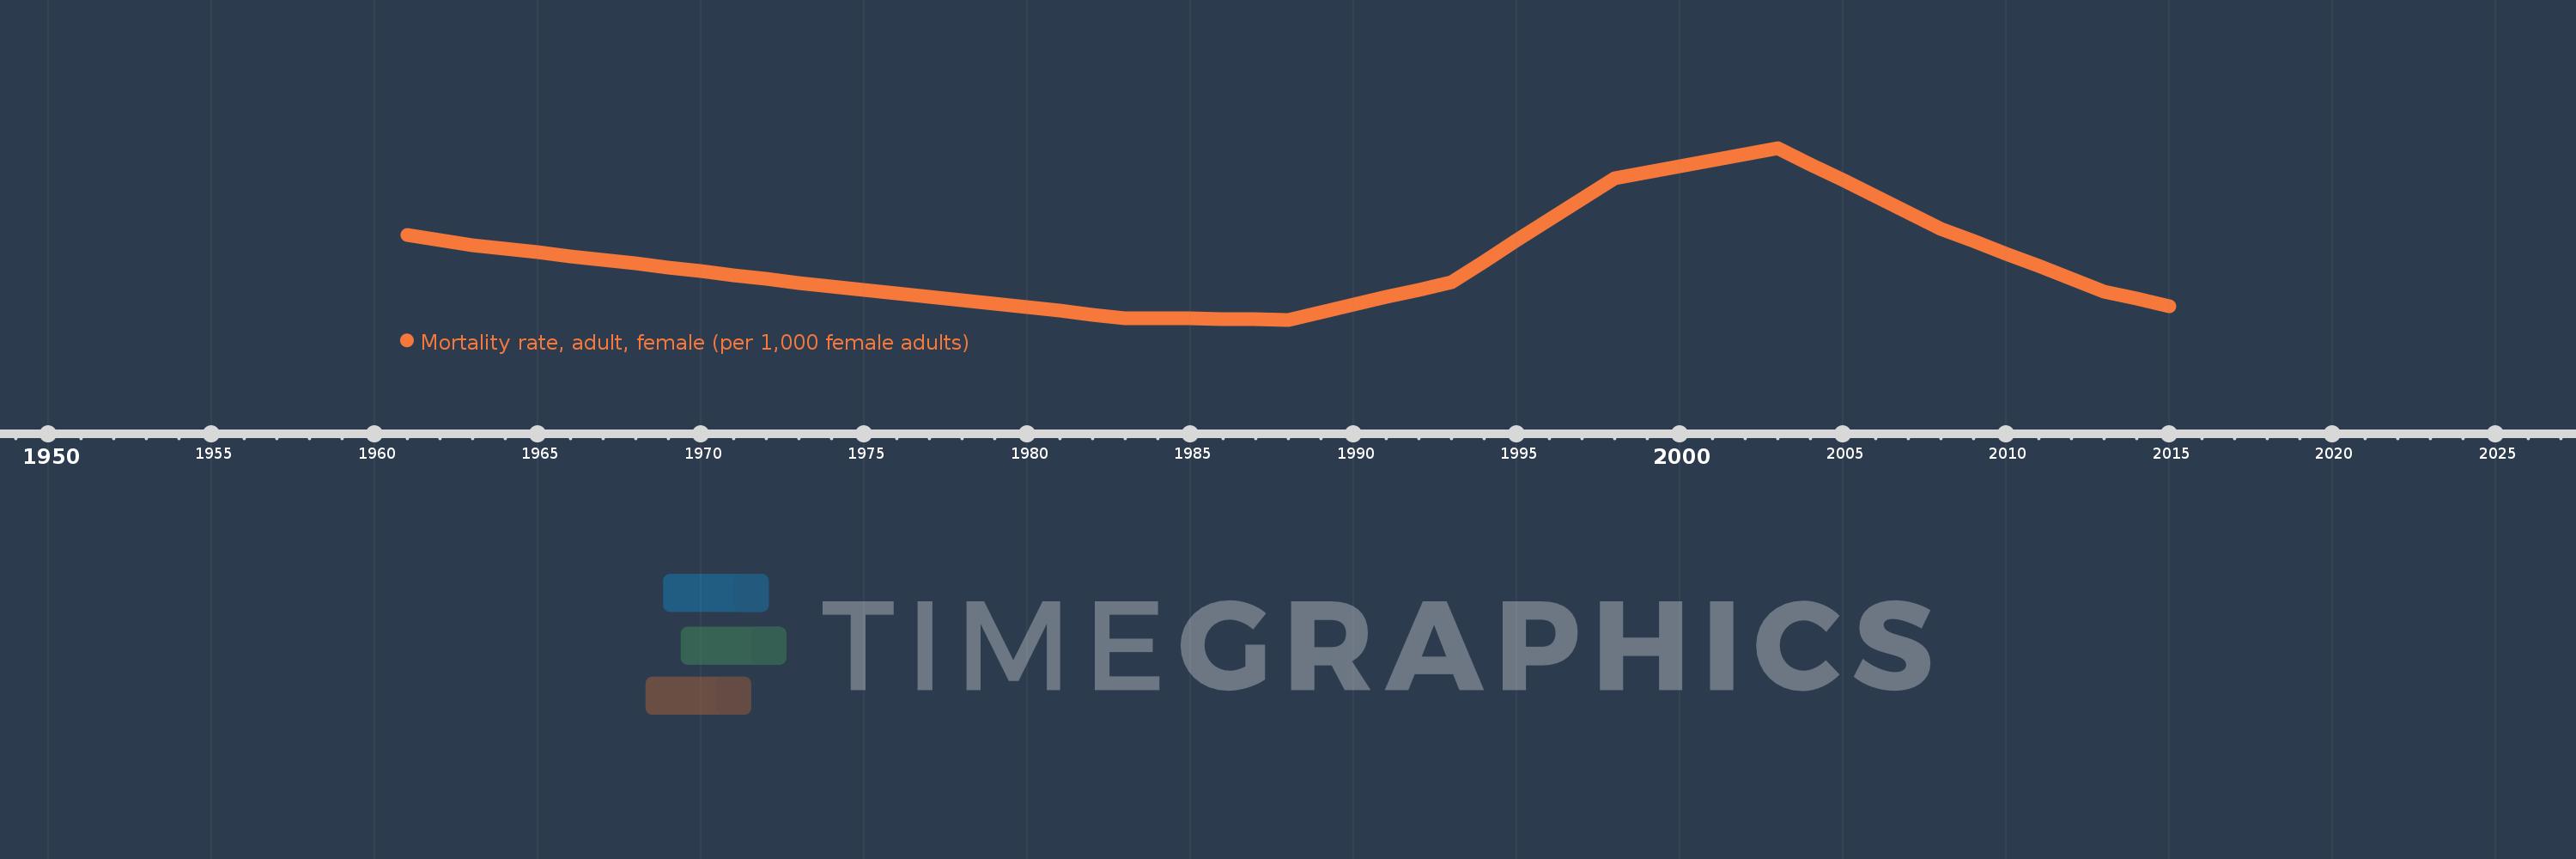
Mortality rate, adult, female (per 1,000 female adults)
2015,2014,2013,2012,2011,2010,2009,2008,2007,2006,2005,2004,2003,2002,2001,2000,1999,1998,1997,1996,1995,1994,1993,1992,1991,1990,1989,1988,1987,1986,1985,1984,1983,1982,1981,1980,1979,1978,1977,1976,1975,1974,1973,1972,1971,1970,1969,1968,1967,1966,1965,1964,1963,1962,1961
This statistics in other country:
AfghanistanAlbaniaAlgeriaAngolaAntigua and BarbudaArab WorldArgentinaArmeniaArubaAustraliaAustriaAzerbaijanBahamas, TheBahrainBangladeshBarbadosBelarusBelgiumBelizeBeninBhutanBoliviaBosnia and HerzegovinaBotswanaBrazilBrunei DarussalamBulgariaBurkina FasoBurundiCabo VerdeCambodiaCameroonCanadaCaribbean small statesCentral African RepublicCentral Europe and the BalticsChadChannel IslandsChileChinaColombiaComorosCongo, Dem. Rep.Congo, Rep.Costa RicaCote d'IvoireCroatiaCubaCuracaoCyprusCzech RepublicDenmarkDjiboutiDominicaDominican RepublicEarly-demographic dividendEast Asia & PacificEast Asia & Pacific (excluding high income)East Asia & Pacific (IDA & IBRD countries)EcuadorEgypt, Arab Rep.El SalvadorEquatorial GuineaEritreaEstoniaEthiopiaEuro areaEurope & Central AsiaEurope & Central Asia (excluding high income)Europe & Central Asia (IDA & IBRD countries)European UnionFijiFinlandFragile and conflict affected situationsFranceFrench PolynesiaGabonGambia, TheGeorgiaGermanyGhanaGreeceGreenlandGrenadaGuamGuatemalaGuineaGuinea-BissauGuyanaHaitiHeavily indebted poor countries (HIPC)High incomeHondurasHong Kong SAR, ChinaHungaryIBRD onlyIcelandIDA & IBRD totalIDA blendIDA onlyIDA totalIndiaIndonesiaIran, Islamic Rep.IraqIrelandIsraelItalyJamaicaJapanJordanKazakhstanKenyaKiribatiKorea, Dem. People’s Rep.Korea, Rep.KuwaitKyrgyz RepublicLao PDRLate-demographic dividendLatin America & Caribbean Latin America & Caribbean (excluding high income)Latin America & the Caribbean (IDA & IBRD countries)LatviaLeast developed countries: UN classificationLebanonLesothoLiberiaLibyaLithuaniaLow & middle incomeLow incomeLower middle incomeLuxembourgMacao SAR, ChinaMacedonia, FYRMadagascarMalawiMalaysiaMaldivesMaliMaltaMarshall IslandsMauritaniaMauritiusMexicoMicronesia, Fed. Sts.Middle East & North AfricaMiddle East & North Africa (excluding high income)Middle East & North Africa (IDA & IBRD countries)Middle incomeMoldovaMongoliaMontenegroMoroccoMozambiqueMyanmarNamibiaNepalNetherlandsNew CaledoniaNew ZealandNicaraguaNigerNigeriaNorth AmericaNorwayOECD membersOmanOther small statesPacific island small statesPakistanPanamaPapua New GuineaParaguayPeruPhilippinesPolandPortugalPost-demographic dividendPre-demographic dividendPuerto RicoQatarRomaniaRussian FederationRwandaSamoaSao Tome and PrincipeSaudi ArabiaSenegalSerbiaSeychellesSierra LeoneSingaporeSlovak RepublicSloveniaSmall statesSolomon IslandsSomaliaSouth AfricaSouth AsiaSouth Asia (IDA & IBRD)South SudanSpainSri LankaSt. Kitts and NevisSt. LuciaSt. Vincent and the GrenadinesSub-Saharan Africa Sub-Saharan Africa (excluding high income)Sub-Saharan Africa (IDA & IBRD countries)SudanSurinameSwazilandSwedenSwitzerlandSyrian Arab RepublicTajikistanTanzaniaThailandTimor-LesteTogoTongaTrinidad and TobagoTunisiaTurkeyTurkmenistanUgandaUkraineUnited Arab EmiratesUnited KingdomUnited StatesUpper middle incomeUruguayUzbekistanVanuatuVenezuela, RBVietnamVirgin Islands (U.S.)West Bank and GazaWorldYemen, Rep.ZambiaZimbabwe Timeline:
This timeline shows a graph from 1961 to 2015 of Kenya. No data until 1960. Number of actual observations by date: 55.
Source name:
World Development Indicators
Source organization:
(1) United Nations Population Division. World Population Prospects. New York, United Nations, Department of Economic and Social Affairs (advanced Excel tables). Available at http://esa.un.org/wpp/unpp/panel_population.htm, (2) University of California, Berkeley, and Max Planck Institute for Demographic Research. Human Mortality Database. [ www.mortality.org or www.humanmortality.de].
Categories, topics:
Health, Gender
Last updated:
apr 23, 2017
Indicators value changes by year
Minimum:
232.134
jan 1, 1988
Maximum:
470.225
jan 1, 2003
At the date of observation
Value
Absolute change
Change from previous value
jan 1, 1961
349.282
+349.282
0.0%
jan 1, 1962
342.331
-6.951
-1.99%
jan 1, 1963
335.38
-6.951
-2.03%
jan 1, 1964
330.329
-5.051
-1.51%
jan 1, 1965
325.278
-5.051
-1.53%
jan 1, 1966
320.227
-5.051
-1.55%
jan 1, 1967
315.176
-5.051
-1.58%
jan 1, 1968
310.125
-5.051
-1.6%
jan 1, 1969
304.691
-5.434
-1.75%
jan 1, 1970
299.258
-5.433
-1.78%
jan 1, 1971
293.824
-5.434
-1.82%
jan 1, 1972
288.391
-5.433
-1.85%
jan 1, 1973
282.957
-5.434
-1.88%
jan 1, 1974
278.237
-4.72
-1.67%
jan 1, 1975
273.518
-4.719
-1.7%
jan 1, 1976
268.798
-4.72
-1.73%
jan 1, 1977
264.079
-4.719
-1.76%
jan 1, 1978
259.359
-4.72
-1.79%
jan 1, 1979
254.393
-4.966
-1.91%
jan 1, 1980
249.428
-4.965
-1.95%
jan 1, 1981
244.462
-4.966
-1.99%
jan 1, 1982
239.497
-4.965
-2.03%
jan 1, 1983
234.531
-4.966
-2.07%
jan 1, 1984
234.052
-0.479
-0.2%
jan 1, 1985
233.572
-0.48
-0.21%
jan 1, 1986
233.093
-0.479
-0.21%
jan 1, 1987
232.614
-0.479
-0.21%
jan 1, 1988
232.134
-0.48
-0.21%
jan 1, 1989
242.599
+10.465
4.51%
jan 1, 1990
253.064
+10.465
4.31%
jan 1, 1991
263.529
+10.465
4.14%
jan 1, 1992
273.993
+10.464
3.97%
jan 1, 1993
284.458
+10.465
3.82%
jan 1, 1994
313.289
+28.831
10.14%
jan 1, 1995
342.12
+28.831
9.2%
jan 1, 1996
370.951
+28.831
8.43%
jan 1, 1997
399.782
+28.831
7.77%
jan 1, 1998
428.613
+28.831
7.21%
jan 1, 1999
436.936
+8.323
1.94%
jan 1, 2000
445.258
+8.322
1.9%
jan 1, 2001
453.58
+8.322
1.87%
jan 1, 2002
461.903
+8.323
1.83%
jan 1, 2003
470.225
+8.322
1.8%
jan 1, 2004
447.841
-22.384
-4.76%
jan 1, 2005
425.457
-22.384
-5.0%
jan 1, 2006
403.073
-22.384
-5.26%
jan 1, 2007
380.689
-22.384
-5.55%
jan 1, 2008
358.306
-22.383
-5.88%
jan 1, 2009
340.932
-17.374
-4.85%
jan 1, 2010
323.559
-17.373
-5.1%
jan 1, 2011
306.185
-17.374
-5.37%
jan 1, 2012
288.811
-17.374
-5.67%
jan 1, 2013
271.438
-17.373
-6.02%
jan 1, 2014
261.129
-10.309
-3.8%
jan 1, 2015
250.82
-10.309
-3.95%
Ranking of countries by current statistics by years


Comments: