29
/
en
AIzaSyAYiBZKx7MnpbEhh9jyipgxe19OcubqV5w
April 1, 2024
208856
New Caledonia
NCL
true
2
1
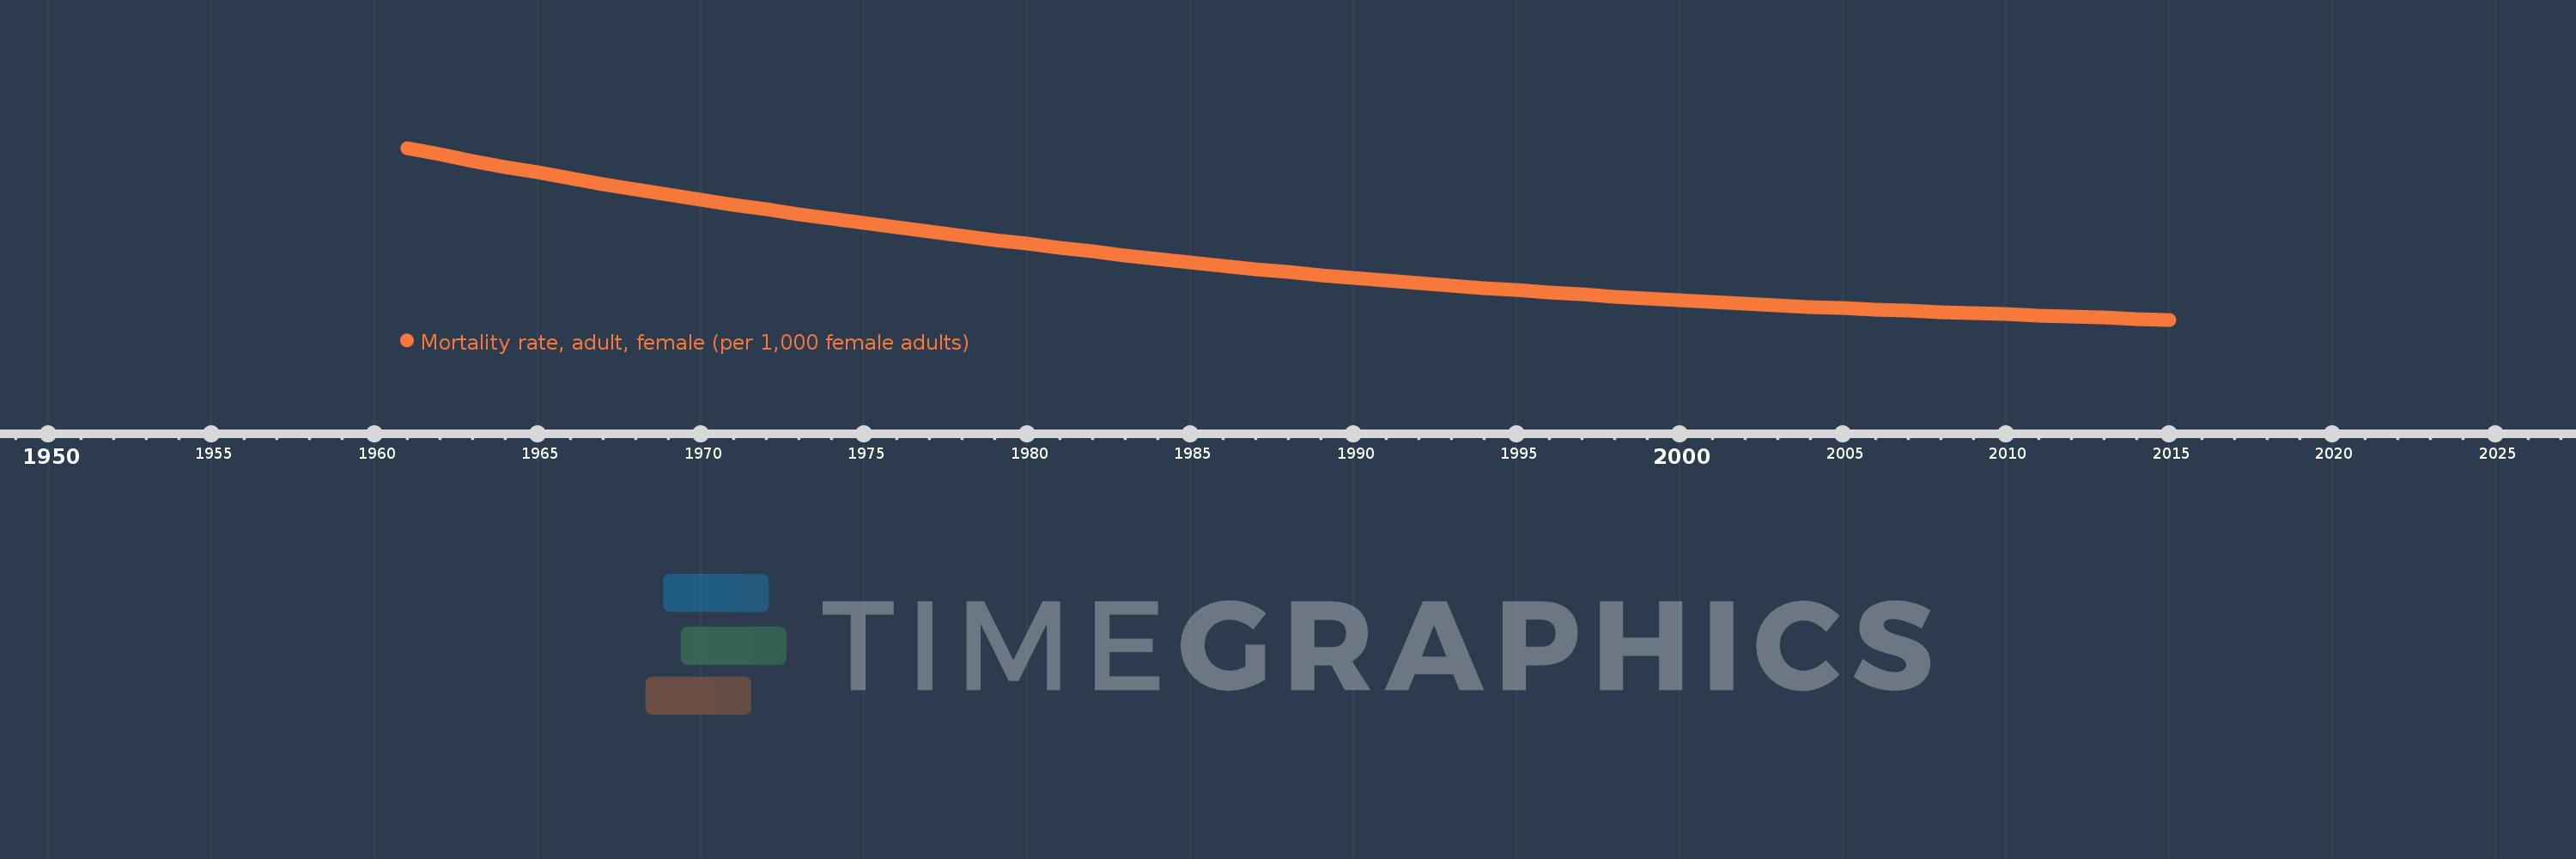
Mortality rate, adult, female (per 1,000 female adults)
2015,2014,2013,2012,2011,2010,2009,2008,2007,2006,2005,2004,2003,2002,2001,2000,1999,1998,1997,1996,1995,1994,1993,1992,1991,1990,1989,1988,1987,1986,1985,1984,1983,1982,1981,1980,1979,1978,1977,1976,1975,1974,1973,1972,1971,1970,1969,1968,1967,1966,1965,1964,1963,1962,1961
This statistics in other country:
AfghanistanAlbaniaAlgeriaAngolaAntigua and BarbudaArab WorldArgentinaArmeniaArubaAustraliaAustriaAzerbaijanBahamas, TheBahrainBangladeshBarbadosBelarusBelgiumBelizeBeninBhutanBoliviaBosnia and HerzegovinaBotswanaBrazilBrunei DarussalamBulgariaBurkina FasoBurundiCabo VerdeCambodiaCameroonCanadaCaribbean small statesCentral African RepublicCentral Europe and the BalticsChadChannel IslandsChileChinaColombiaComorosCongo, Dem. Rep.Congo, Rep.Costa RicaCote d'IvoireCroatiaCubaCuracaoCyprusCzech RepublicDenmarkDjiboutiDominicaDominican RepublicEarly-demographic dividendEast Asia & PacificEast Asia & Pacific (excluding high income)East Asia & Pacific (IDA & IBRD countries)EcuadorEgypt, Arab Rep.El SalvadorEquatorial GuineaEritreaEstoniaEthiopiaEuro areaEurope & Central AsiaEurope & Central Asia (excluding high income)Europe & Central Asia (IDA & IBRD countries)European UnionFijiFinlandFragile and conflict affected situationsFranceFrench PolynesiaGabonGambia, TheGeorgiaGermanyGhanaGreeceGreenlandGrenadaGuamGuatemalaGuineaGuinea-BissauGuyanaHaitiHeavily indebted poor countries (HIPC)High incomeHondurasHong Kong SAR, ChinaHungaryIBRD onlyIcelandIDA & IBRD totalIDA blendIDA onlyIDA totalIndiaIndonesiaIran, Islamic Rep.IraqIrelandIsraelItalyJamaicaJapanJordanKazakhstanKenyaKiribatiKorea, Dem. People’s Rep.Korea, Rep.KuwaitKyrgyz RepublicLao PDRLate-demographic dividendLatin America & Caribbean Latin America & Caribbean (excluding high income)Latin America & the Caribbean (IDA & IBRD countries)LatviaLeast developed countries: UN classificationLebanonLesothoLiberiaLibyaLithuaniaLow & middle incomeLow incomeLower middle incomeLuxembourgMacao SAR, ChinaMacedonia, FYRMadagascarMalawiMalaysiaMaldivesMaliMaltaMarshall IslandsMauritaniaMauritiusMexicoMicronesia, Fed. Sts.Middle East & North AfricaMiddle East & North Africa (excluding high income)Middle East & North Africa (IDA & IBRD countries)Middle incomeMoldovaMongoliaMontenegroMoroccoMozambiqueMyanmarNamibiaNepalNetherlandsNew CaledoniaNew ZealandNicaraguaNigerNigeriaNorth AmericaNorwayOECD membersOmanOther small statesPacific island small statesPakistanPanamaPapua New GuineaParaguayPeruPhilippinesPolandPortugalPost-demographic dividendPre-demographic dividendPuerto RicoQatarRomaniaRussian FederationRwandaSamoaSao Tome and PrincipeSaudi ArabiaSenegalSerbiaSeychellesSierra LeoneSingaporeSlovak RepublicSloveniaSmall statesSolomon IslandsSomaliaSouth AfricaSouth AsiaSouth Asia (IDA & IBRD)South SudanSpainSri LankaSt. Kitts and NevisSt. LuciaSt. Vincent and the GrenadinesSub-Saharan Africa Sub-Saharan Africa (excluding high income)Sub-Saharan Africa (IDA & IBRD countries)SudanSurinameSwazilandSwedenSwitzerlandSyrian Arab RepublicTajikistanTanzaniaThailandTimor-LesteTogoTongaTrinidad and TobagoTunisiaTurkeyTurkmenistanUgandaUkraineUnited Arab EmiratesUnited KingdomUnited StatesUpper middle incomeUruguayUzbekistanVanuatuVenezuela, RBVietnamVirgin Islands (U.S.)West Bank and GazaWorldYemen, Rep.ZambiaZimbabwe Timeline:
This timeline shows a graph from 1961 to 2015 of New Caledonia. No data until 1960. Number of actual observations by date: 55.
Source name:
World Development Indicators
Source organization:
(1) United Nations Population Division. World Population Prospects. New York, United Nations, Department of Economic and Social Affairs (advanced Excel tables). Available at http://esa.un.org/wpp/unpp/panel_population.htm, (2) University of California, Berkeley, and Max Planck Institute for Demographic Research. Human Mortality Database. [ www.mortality.org or www.humanmortality.de].
Categories, topics:
Health, Gender
Last updated:
apr 23, 2017
Indicators value changes by year
Minimum:
60.854
jan 1, 2015
Maximum:
273.968
jan 1, 1961
At the date of observation
Value
Absolute change
Change from previous value
jan 1, 1961
273.968
+273.968
0.0%
jan 1, 1962
265.783
-8.185
-2.99%
jan 1, 1963
257.598
-8.185
-3.08%
jan 1, 1964
250.495
-7.103
-2.76%
jan 1, 1965
243.391
-7.104
-2.84%
jan 1, 1966
236.288
-7.103
-2.92%
jan 1, 1967
229.184
-7.104
-3.01%
jan 1, 1968
222.081
-7.103
-3.1%
jan 1, 1969
215.984
-6.097
-2.75%
jan 1, 1970
209.887
-6.097
-2.82%
jan 1, 1971
203.791
-6.096
-2.9%
jan 1, 1972
197.694
-6.097
-2.99%
jan 1, 1973
191.597
-6.097
-3.08%
jan 1, 1974
186.212
-5.385
-2.81%
jan 1, 1975
180.827
-5.385
-2.89%
jan 1, 1976
175.442
-5.385
-2.98%
jan 1, 1977
170.056
-5.386
-3.07%
jan 1, 1978
164.671
-5.385
-3.17%
jan 1, 1979
159.841
-4.83
-2.93%
jan 1, 1980
155.01
-4.831
-3.02%
jan 1, 1981
150.18
-4.83
-3.12%
jan 1, 1982
145.35
-4.83
-3.22%
jan 1, 1983
140.519
-4.831
-3.32%
jan 1, 1984
136.352
-4.167
-2.97%
jan 1, 1985
132.186
-4.166
-3.06%
jan 1, 1986
128.019
-4.167
-3.15%
jan 1, 1987
123.852
-4.167
-3.25%
jan 1, 1988
119.685
-4.167
-3.36%
jan 1, 1989
116.287
-3.398
-2.84%
jan 1, 1990
112.89
-3.397
-2.92%
jan 1, 1991
109.492
-3.398
-3.01%
jan 1, 1992
106.095
-3.397
-3.1%
jan 1, 1993
102.697
-3.398
-3.2%
jan 1, 1994
100.03
-2.667
-2.6%
jan 1, 1995
97.363
-2.667
-2.67%
jan 1, 1996
94.696
-2.667
-2.74%
jan 1, 1997
92.028
-2.668
-2.82%
jan 1, 1998
89.361
-2.667
-2.9%
jan 1, 1999
87.231
-2.13
-2.38%
jan 1, 2000
85.101
-2.13
-2.44%
jan 1, 2001
82.971
-2.13
-2.5%
jan 1, 2002
80.841
-2.13
-2.57%
jan 1, 2003
78.711
-2.13
-2.63%
jan 1, 2004
77.036
-1.675
-2.13%
jan 1, 2005
75.362
-1.674
-2.17%
jan 1, 2006
73.687
-1.675
-2.22%
jan 1, 2007
72.012
-1.675
-2.27%
jan 1, 2008
70.338
-1.674
-2.32%
jan 1, 2009
68.925
-1.413
-2.01%
jan 1, 2010
67.513
-1.412
-2.05%
jan 1, 2011
66.101
-1.412
-2.09%
jan 1, 2012
64.689
-1.412
-2.14%
jan 1, 2013
63.277
-1.412
-2.18%
jan 1, 2014
62.065
-1.212
-1.92%
jan 1, 2015
60.854
-1.211
-1.95%
Ranking of countries by current statistics by years


Comments: