29
/
en
AIzaSyAYiBZKx7MnpbEhh9jyipgxe19OcubqV5w
April 1, 2024
51153
Middle income
MIC
false
2
1
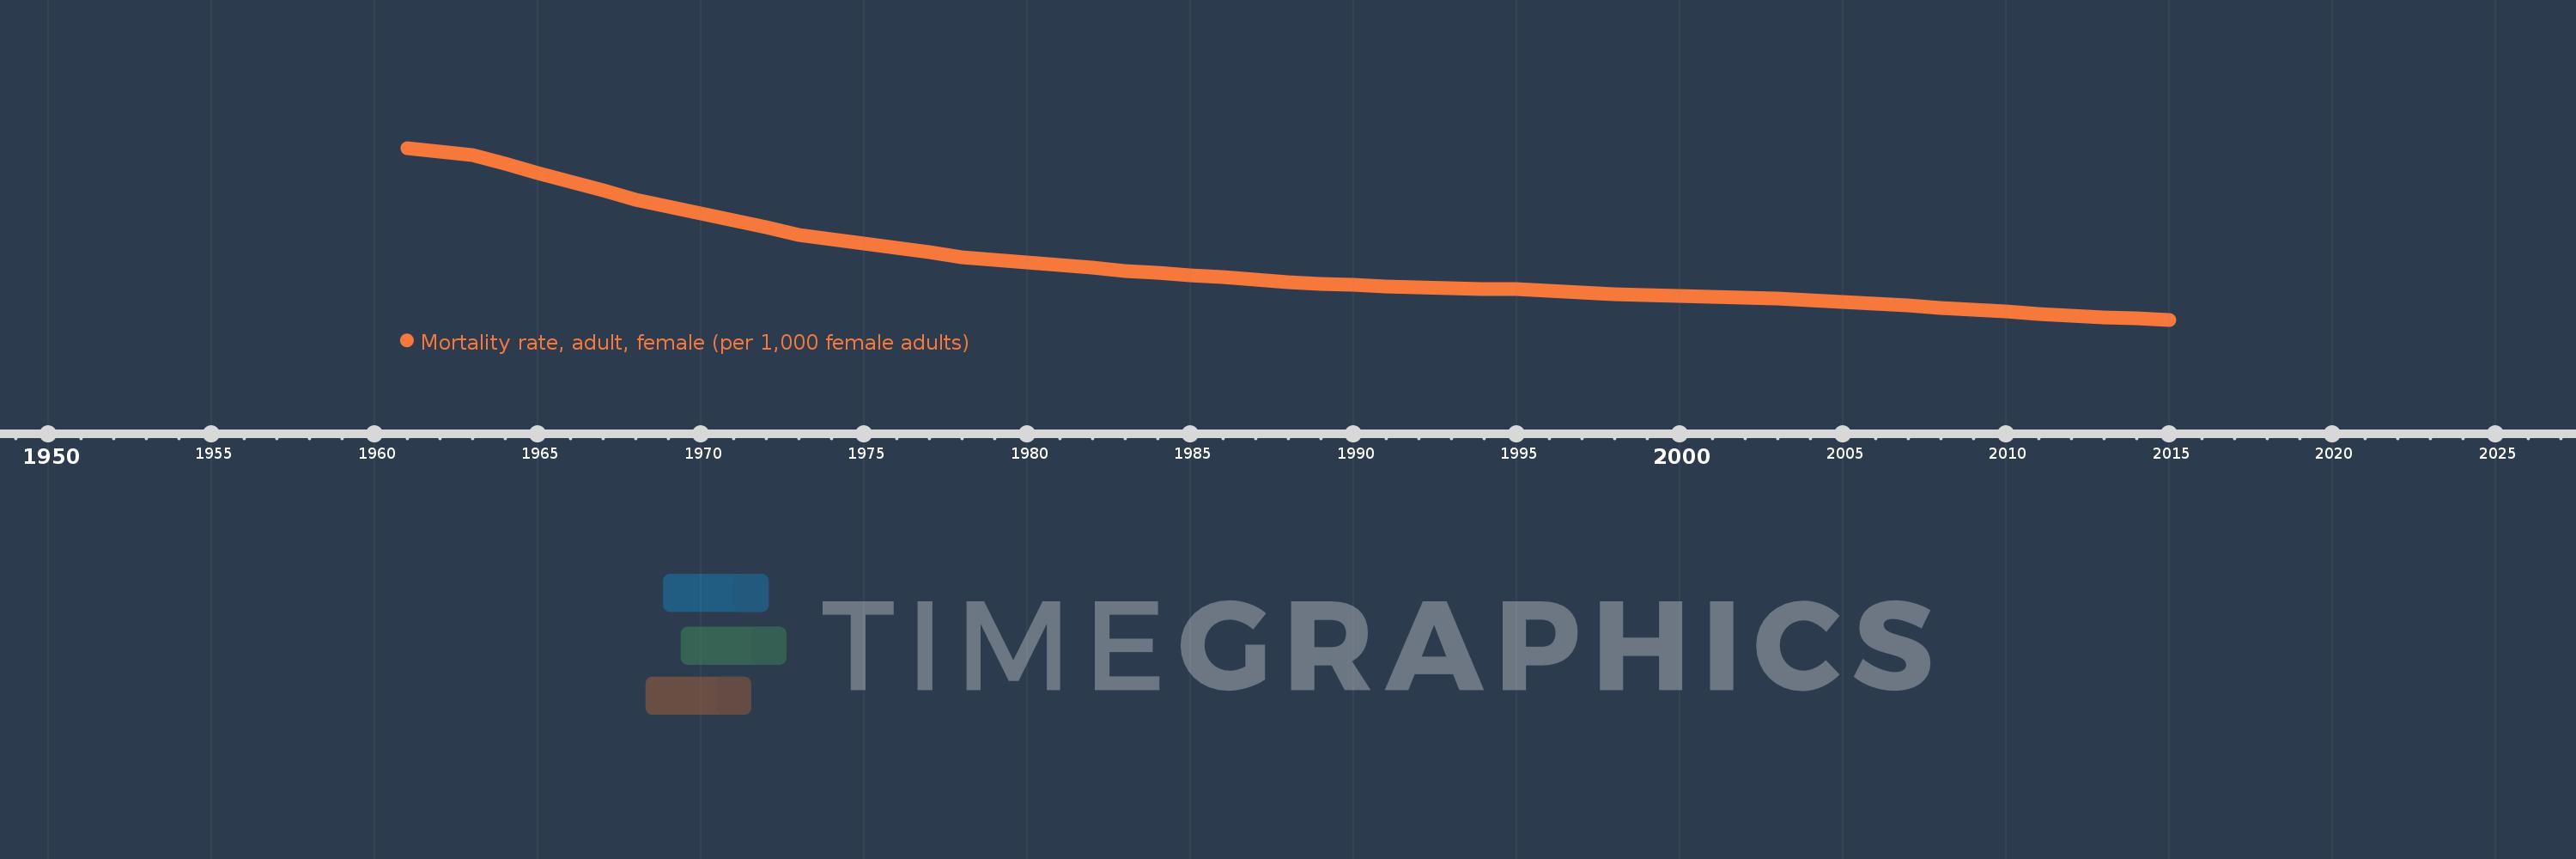
Mortality rate, adult, female (per 1,000 female adults)
2015,2014,2013,2012,2011,2010,2009,2008,2007,2006,2005,2004,2003,2002,2001,2000,1999,1998,1997,1996,1995,1994,1993,1992,1991,1990,1989,1988,1987,1986,1985,1984,1983,1982,1981,1980,1979,1978,1977,1976,1975,1974,1973,1972,1971,1970,1969,1968,1967,1966,1965,1964,1963,1962,1961
This statistics in other country:
AfghanistanAlbaniaAlgeriaAngolaAntigua and BarbudaArab WorldArgentinaArmeniaArubaAustraliaAustriaAzerbaijanBahamas, TheBahrainBangladeshBarbadosBelarusBelgiumBelizeBeninBhutanBoliviaBosnia and HerzegovinaBotswanaBrazilBrunei DarussalamBulgariaBurkina FasoBurundiCabo VerdeCambodiaCameroonCanadaCaribbean small statesCentral African RepublicCentral Europe and the BalticsChadChannel IslandsChileChinaColombiaComorosCongo, Dem. Rep.Congo, Rep.Costa RicaCote d'IvoireCroatiaCubaCuracaoCyprusCzech RepublicDenmarkDjiboutiDominicaDominican RepublicEarly-demographic dividendEast Asia & PacificEast Asia & Pacific (excluding high income)East Asia & Pacific (IDA & IBRD countries)EcuadorEgypt, Arab Rep.El SalvadorEquatorial GuineaEritreaEstoniaEthiopiaEuro areaEurope & Central AsiaEurope & Central Asia (excluding high income)Europe & Central Asia (IDA & IBRD countries)European UnionFijiFinlandFragile and conflict affected situationsFranceFrench PolynesiaGabonGambia, TheGeorgiaGermanyGhanaGreeceGreenlandGrenadaGuamGuatemalaGuineaGuinea-BissauGuyanaHaitiHeavily indebted poor countries (HIPC)High incomeHondurasHong Kong SAR, ChinaHungaryIBRD onlyIcelandIDA & IBRD totalIDA blendIDA onlyIDA totalIndiaIndonesiaIran, Islamic Rep.IraqIrelandIsraelItalyJamaicaJapanJordanKazakhstanKenyaKiribatiKorea, Dem. People’s Rep.Korea, Rep.KuwaitKyrgyz RepublicLao PDRLate-demographic dividendLatin America & Caribbean Latin America & Caribbean (excluding high income)Latin America & the Caribbean (IDA & IBRD countries)LatviaLeast developed countries: UN classificationLebanonLesothoLiberiaLibyaLithuaniaLow & middle incomeLow incomeLower middle incomeLuxembourgMacao SAR, ChinaMacedonia, FYRMadagascarMalawiMalaysiaMaldivesMaliMaltaMarshall IslandsMauritaniaMauritiusMexicoMicronesia, Fed. Sts.Middle East & North AfricaMiddle East & North Africa (excluding high income)Middle East & North Africa (IDA & IBRD countries)Middle incomeMoldovaMongoliaMontenegroMoroccoMozambiqueMyanmarNamibiaNepalNetherlandsNew CaledoniaNew ZealandNicaraguaNigerNigeriaNorth AmericaNorwayOECD membersOmanOther small statesPacific island small statesPakistanPanamaPapua New GuineaParaguayPeruPhilippinesPolandPortugalPost-demographic dividendPre-demographic dividendPuerto RicoQatarRomaniaRussian FederationRwandaSamoaSao Tome and PrincipeSaudi ArabiaSenegalSerbiaSeychellesSierra LeoneSingaporeSlovak RepublicSloveniaSmall statesSolomon IslandsSomaliaSouth AfricaSouth AsiaSouth Asia (IDA & IBRD)South SudanSpainSri LankaSt. Kitts and NevisSt. LuciaSt. Vincent and the GrenadinesSub-Saharan Africa Sub-Saharan Africa (excluding high income)Sub-Saharan Africa (IDA & IBRD countries)SudanSurinameSwazilandSwedenSwitzerlandSyrian Arab RepublicTajikistanTanzaniaThailandTimor-LesteTogoTongaTrinidad and TobagoTunisiaTurkeyTurkmenistanUgandaUkraineUnited Arab EmiratesUnited KingdomUnited StatesUpper middle incomeUruguayUzbekistanVanuatuVenezuela, RBVietnamVirgin Islands (U.S.)West Bank and GazaWorldYemen, Rep.ZambiaZimbabwe Timeline:
This timeline shows a graph from 1961 to 2015 of Middle income. No data until 1960. Number of actual observations by date: 55.
Source name:
World Development Indicators
Source organization:
(1) United Nations Population Division. World Population Prospects. New York, United Nations, Department of Economic and Social Affairs (advanced Excel tables). Available at http://esa.un.org/wpp/unpp/panel_population.htm, (2) University of California, Berkeley, and Max Planck Institute for Demographic Research. Human Mortality Database. [ www.mortality.org or www.humanmortality.de].
Categories, topics:
Health, Gender
Last updated:
apr 23, 2017
Indicators value changes by year
Minimum:
122.243
jan 1, 2015
Maximum:
353.252
jan 1, 1961
At the date of observation
Value
Absolute change
Change from previous value
jan 1, 1961
353.252
+353.252
0.0%
jan 1, 1962
348.25
-5.002
-1.42%
jan 1, 1963
343.576
-4.675
-1.34%
jan 1, 1964
331.538
-12.038
-3.5%
jan 1, 1965
319.297
-12.241
-3.69%
jan 1, 1966
307.664
-11.633
-3.64%
jan 1, 1967
295.856
-11.808
-3.84%
jan 1, 1968
284.162
-11.694
-3.95%
jan 1, 1969
274.641
-9.521
-3.35%
jan 1, 1970
265.426
-9.215
-3.36%
jan 1, 1971
255.95
-9.476
-3.57%
jan 1, 1972
246.165
-9.785
-3.82%
jan 1, 1973
236.613
-9.553
-3.88%
jan 1, 1974
230.463
-6.15
-2.6%
jan 1, 1975
224.512
-5.951
-2.58%
jan 1, 1976
218.754
-5.758
-2.56%
jan 1, 1977
212.709
-6.045
-2.76%
jan 1, 1978
206.556
-6.153
-2.89%
jan 1, 1979
203.019
-3.537
-1.71%
jan 1, 1980
199.431
-3.588
-1.77%
jan 1, 1981
195.783
-3.648
-1.83%
jan 1, 1982
191.789
-3.994
-2.04%
jan 1, 1983
187.728
-4.06
-2.12%
jan 1, 1984
185.023
-2.705
-1.44%
jan 1, 1985
182.506
-2.518
-1.36%
jan 1, 1986
179.406
-3.1
-1.7%
jan 1, 1987
175.71
-3.696
-2.06%
jan 1, 1988
172.949
-2.761
-1.57%
jan 1, 1989
170.89
-2.058
-1.19%
jan 1, 1990
169.033
-1.857
-1.09%
jan 1, 1991
167.204
-1.829
-1.08%
jan 1, 1992
165.452
-1.752
-1.05%
jan 1, 1993
164.058
-1.394
-0.84%
jan 1, 1994
163.886
-0.172
-0.1%
jan 1, 1995
163.168
-0.718
-0.44%
jan 1, 1996
161.447
-1.72
-1.05%
jan 1, 1997
159.18
-2.267
-1.4%
jan 1, 1998
157.111
-2.069
-1.3%
jan 1, 1999
155.415
-1.696
-1.08%
jan 1, 2000
154.508
-0.906
-0.58%
jan 1, 2001
153.37
-1.138
-0.74%
jan 1, 2002
152.067
-1.303
-0.85%
jan 1, 2003
150.795
-1.272
-0.84%
jan 1, 2004
148.65
-2.145
-1.42%
jan 1, 2005
146.212
-2.438
-1.64%
jan 1, 2006
143.956
-2.256
-1.54%
jan 1, 2007
141.075
-2.881
-2.0%
jan 1, 2008
138.515
-2.56
-1.81%
jan 1, 2009
135.941
-2.574
-1.86%
jan 1, 2010
133.057
-2.884
-2.12%
jan 1, 2011
130.466
-2.591
-1.95%
jan 1, 2012
127.737
-2.73
-2.09%
jan 1, 2013
125.218
-2.519
-1.97%
jan 1, 2014
123.671
-1.547
-1.24%
jan 1, 2015
122.243
-1.428
-1.15%
Ranking of countries by current statistics by years


Comments: