29
/
en
AIzaSyAYiBZKx7MnpbEhh9jyipgxe19OcubqV5w
April 1, 2024
176702
Lebanon
LBN
true
2
1
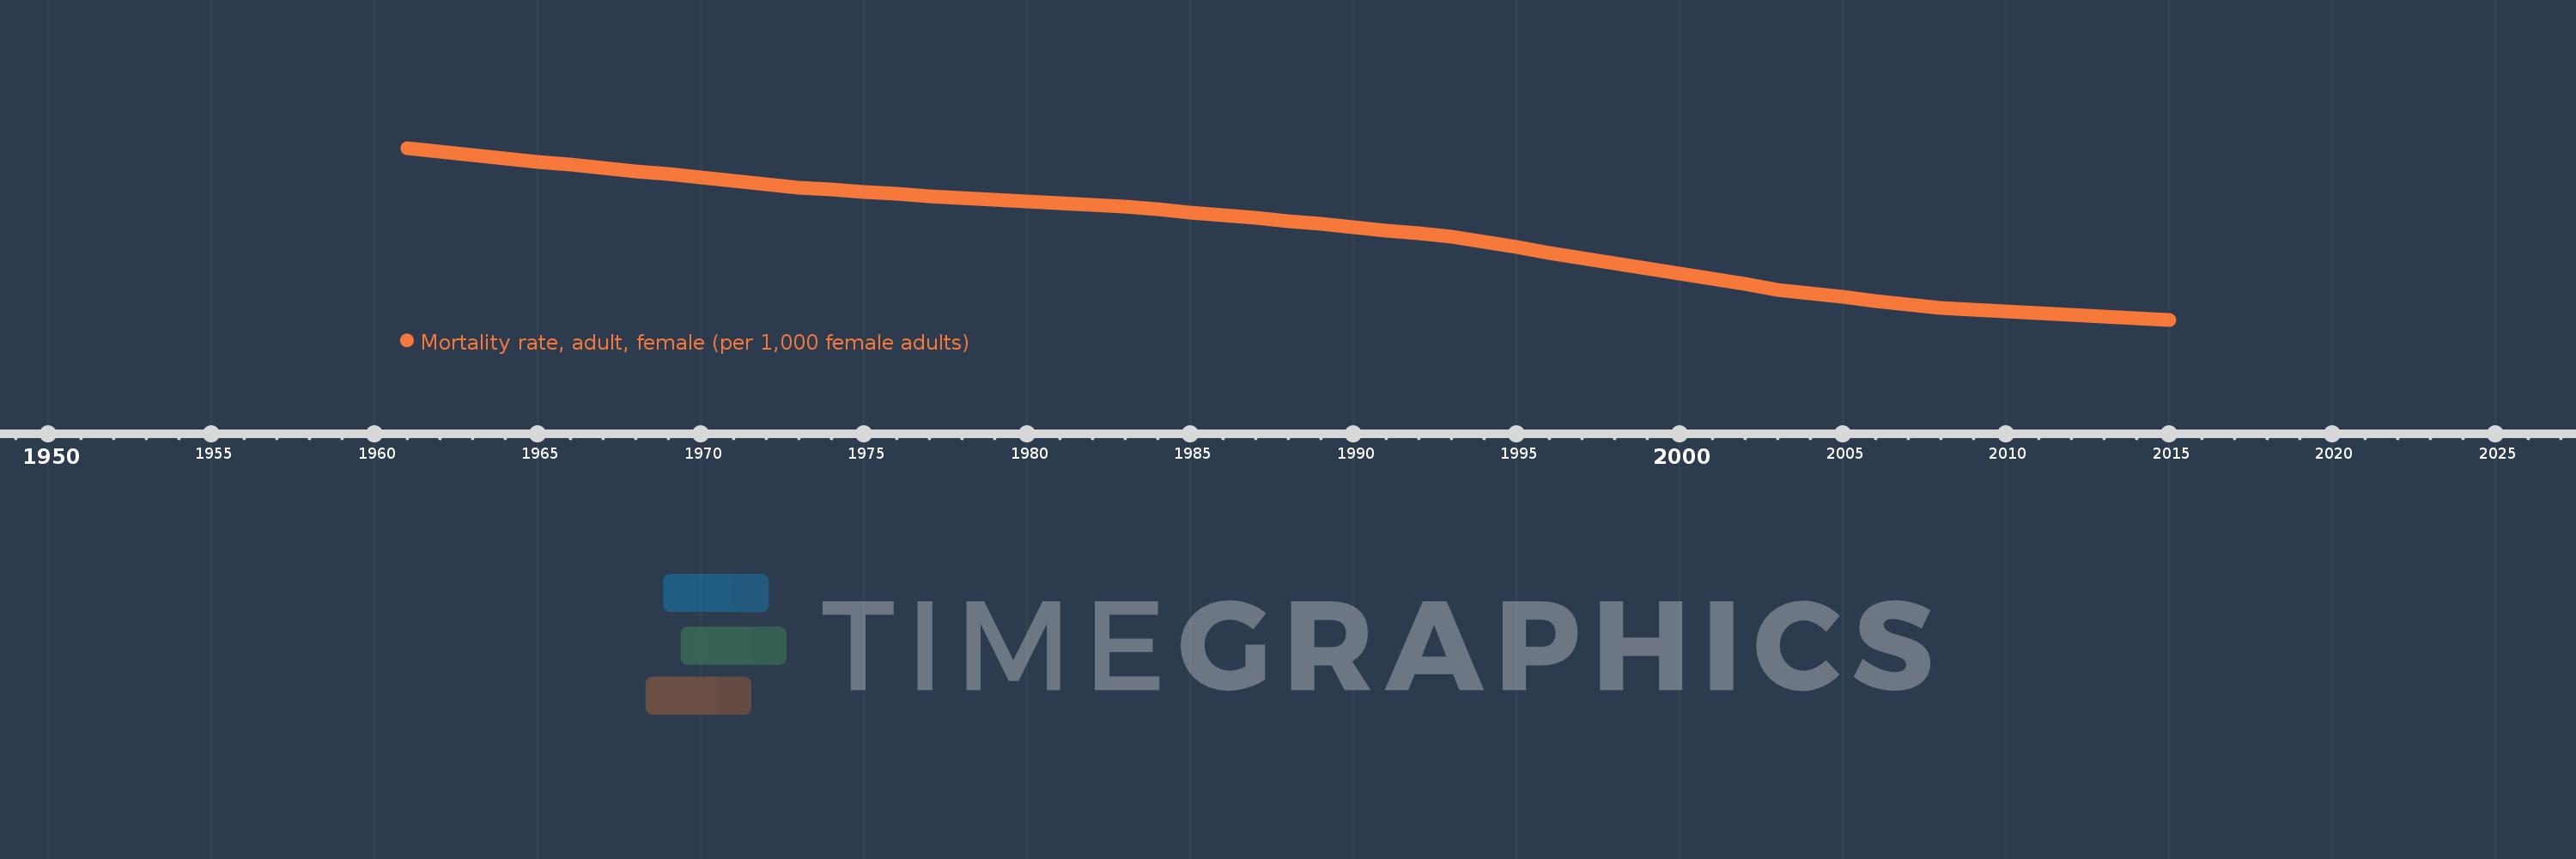
Mortality rate, adult, female (per 1,000 female adults)
2015,2014,2013,2012,2011,2010,2009,2008,2007,2006,2005,2004,2003,2002,2001,2000,1999,1998,1997,1996,1995,1994,1993,1992,1991,1990,1989,1988,1987,1986,1985,1984,1983,1982,1981,1980,1979,1978,1977,1976,1975,1974,1973,1972,1971,1970,1969,1968,1967,1966,1965,1964,1963,1962,1961
This statistics in other country:
AfghanistanAlbaniaAlgeriaAngolaAntigua and BarbudaArab WorldArgentinaArmeniaArubaAustraliaAustriaAzerbaijanBahamas, TheBahrainBangladeshBarbadosBelarusBelgiumBelizeBeninBhutanBoliviaBosnia and HerzegovinaBotswanaBrazilBrunei DarussalamBulgariaBurkina FasoBurundiCabo VerdeCambodiaCameroonCanadaCaribbean small statesCentral African RepublicCentral Europe and the BalticsChadChannel IslandsChileChinaColombiaComorosCongo, Dem. Rep.Congo, Rep.Costa RicaCote d'IvoireCroatiaCubaCuracaoCyprusCzech RepublicDenmarkDjiboutiDominicaDominican RepublicEarly-demographic dividendEast Asia & PacificEast Asia & Pacific (excluding high income)East Asia & Pacific (IDA & IBRD countries)EcuadorEgypt, Arab Rep.El SalvadorEquatorial GuineaEritreaEstoniaEthiopiaEuro areaEurope & Central AsiaEurope & Central Asia (excluding high income)Europe & Central Asia (IDA & IBRD countries)European UnionFijiFinlandFragile and conflict affected situationsFranceFrench PolynesiaGabonGambia, TheGeorgiaGermanyGhanaGreeceGreenlandGrenadaGuamGuatemalaGuineaGuinea-BissauGuyanaHaitiHeavily indebted poor countries (HIPC)High incomeHondurasHong Kong SAR, ChinaHungaryIBRD onlyIcelandIDA & IBRD totalIDA blendIDA onlyIDA totalIndiaIndonesiaIran, Islamic Rep.IraqIrelandIsraelItalyJamaicaJapanJordanKazakhstanKenyaKiribatiKorea, Dem. People’s Rep.Korea, Rep.KuwaitKyrgyz RepublicLao PDRLate-demographic dividendLatin America & Caribbean Latin America & Caribbean (excluding high income)Latin America & the Caribbean (IDA & IBRD countries)LatviaLeast developed countries: UN classificationLebanonLesothoLiberiaLibyaLithuaniaLow & middle incomeLow incomeLower middle incomeLuxembourgMacao SAR, ChinaMacedonia, FYRMadagascarMalawiMalaysiaMaldivesMaliMaltaMarshall IslandsMauritaniaMauritiusMexicoMicronesia, Fed. Sts.Middle East & North AfricaMiddle East & North Africa (excluding high income)Middle East & North Africa (IDA & IBRD countries)Middle incomeMoldovaMongoliaMontenegroMoroccoMozambiqueMyanmarNamibiaNepalNetherlandsNew CaledoniaNew ZealandNicaraguaNigerNigeriaNorth AmericaNorwayOECD membersOmanOther small statesPacific island small statesPakistanPanamaPapua New GuineaParaguayPeruPhilippinesPolandPortugalPost-demographic dividendPre-demographic dividendPuerto RicoQatarRomaniaRussian FederationRwandaSamoaSao Tome and PrincipeSaudi ArabiaSenegalSerbiaSeychellesSierra LeoneSingaporeSlovak RepublicSloveniaSmall statesSolomon IslandsSomaliaSouth AfricaSouth AsiaSouth Asia (IDA & IBRD)South SudanSpainSri LankaSt. Kitts and NevisSt. LuciaSt. Vincent and the GrenadinesSub-Saharan Africa Sub-Saharan Africa (excluding high income)Sub-Saharan Africa (IDA & IBRD countries)SudanSurinameSwazilandSwedenSwitzerlandSyrian Arab RepublicTajikistanTanzaniaThailandTimor-LesteTogoTongaTrinidad and TobagoTunisiaTurkeyTurkmenistanUgandaUkraineUnited Arab EmiratesUnited KingdomUnited StatesUpper middle incomeUruguayUzbekistanVanuatuVenezuela, RBVietnamVirgin Islands (U.S.)West Bank and GazaWorldYemen, Rep.ZambiaZimbabwe Timeline:
This timeline shows a graph from 1961 to 2015 of Lebanon. No data until 1960. Number of actual observations by date: 55.
Source name:
World Development Indicators
Source organization:
(1) United Nations Population Division. World Population Prospects. New York, United Nations, Department of Economic and Social Affairs (advanced Excel tables). Available at http://esa.un.org/wpp/unpp/panel_population.htm, (2) University of California, Berkeley, and Max Planck Institute for Demographic Research. Human Mortality Database. [ www.mortality.org or www.humanmortality.de].
Categories, topics:
Health, Gender
Last updated:
apr 23, 2017
Indicators value changes by year
Minimum:
50.298
jan 1, 2015
Maximum:
202.676
jan 1, 1961
At the date of observation
Value
Absolute change
Change from previous value
jan 1, 1961
202.676
+202.676
0.0%
jan 1, 1962
199.343
-3.333
-1.64%
jan 1, 1963
196.01
-3.333
-1.67%
jan 1, 1964
193.234
-2.776
-1.42%
jan 1, 1965
190.457
-2.777
-1.44%
jan 1, 1966
187.681
-2.776
-1.46%
jan 1, 1967
184.905
-2.776
-1.48%
jan 1, 1968
182.129
-2.776
-1.5%
jan 1, 1969
179.214
-2.915
-1.6%
jan 1, 1970
176.3
-2.914
-1.63%
jan 1, 1971
173.385
-2.915
-1.65%
jan 1, 1972
170.471
-2.914
-1.68%
jan 1, 1973
167.556
-2.915
-1.71%
jan 1, 1974
165.677
-1.879
-1.12%
jan 1, 1975
163.798
-1.879
-1.13%
jan 1, 1976
161.918
-1.88
-1.15%
jan 1, 1977
160.039
-1.879
-1.16%
jan 1, 1978
158.16
-1.879
-1.17%
jan 1, 1979
156.648
-1.512
-0.96%
jan 1, 1980
155.137
-1.511
-0.96%
jan 1, 1981
153.625
-1.512
-0.97%
jan 1, 1982
152.114
-1.511
-0.98%
jan 1, 1983
150.602
-1.512
-0.99%
jan 1, 1984
148.073
-2.529
-1.68%
jan 1, 1985
145.544
-2.529
-1.71%
jan 1, 1986
143.015
-2.529
-1.74%
jan 1, 1987
140.486
-2.529
-1.77%
jan 1, 1988
137.957
-2.529
-1.8%
jan 1, 1989
135.14
-2.817
-2.04%
jan 1, 1990
132.323
-2.817
-2.08%
jan 1, 1991
129.506
-2.817
-2.13%
jan 1, 1992
126.689
-2.817
-2.18%
jan 1, 1993
123.872
-2.817
-2.22%
jan 1, 1994
119.188
-4.684
-3.78%
jan 1, 1995
114.503
-4.685
-3.93%
jan 1, 1996
109.819
-4.684
-4.09%
jan 1, 1997
105.135
-4.684
-4.27%
jan 1, 1998
100.45
-4.685
-4.46%
jan 1, 1999
95.771
-4.679
-4.66%
jan 1, 2000
91.091
-4.68
-4.89%
jan 1, 2001
86.412
-4.679
-5.14%
jan 1, 2002
81.732
-4.68
-5.42%
jan 1, 2003
77.053
-4.679
-5.72%
jan 1, 2004
73.733
-3.32
-4.31%
jan 1, 2005
70.414
-3.319
-4.5%
jan 1, 2006
67.094
-3.32
-4.71%
jan 1, 2007
63.775
-3.319
-4.95%
jan 1, 2008
60.456
-3.319
-5.2%
jan 1, 2009
58.996
-1.46
-2.41%
jan 1, 2010
57.537
-1.459
-2.47%
jan 1, 2011
56.078
-1.459
-2.54%
jan 1, 2012
54.619
-1.459
-2.6%
jan 1, 2013
53.159
-1.46
-2.67%
jan 1, 2014
51.729
-1.43
-2.69%
jan 1, 2015
50.298
-1.431
-2.77%
Ranking of countries by current statistics by years


Comments: