29
/
en
AIzaSyAYiBZKx7MnpbEhh9jyipgxe19OcubqV5w
April 1, 2024
281300
Venezuela, RB
VEN
true
2
1
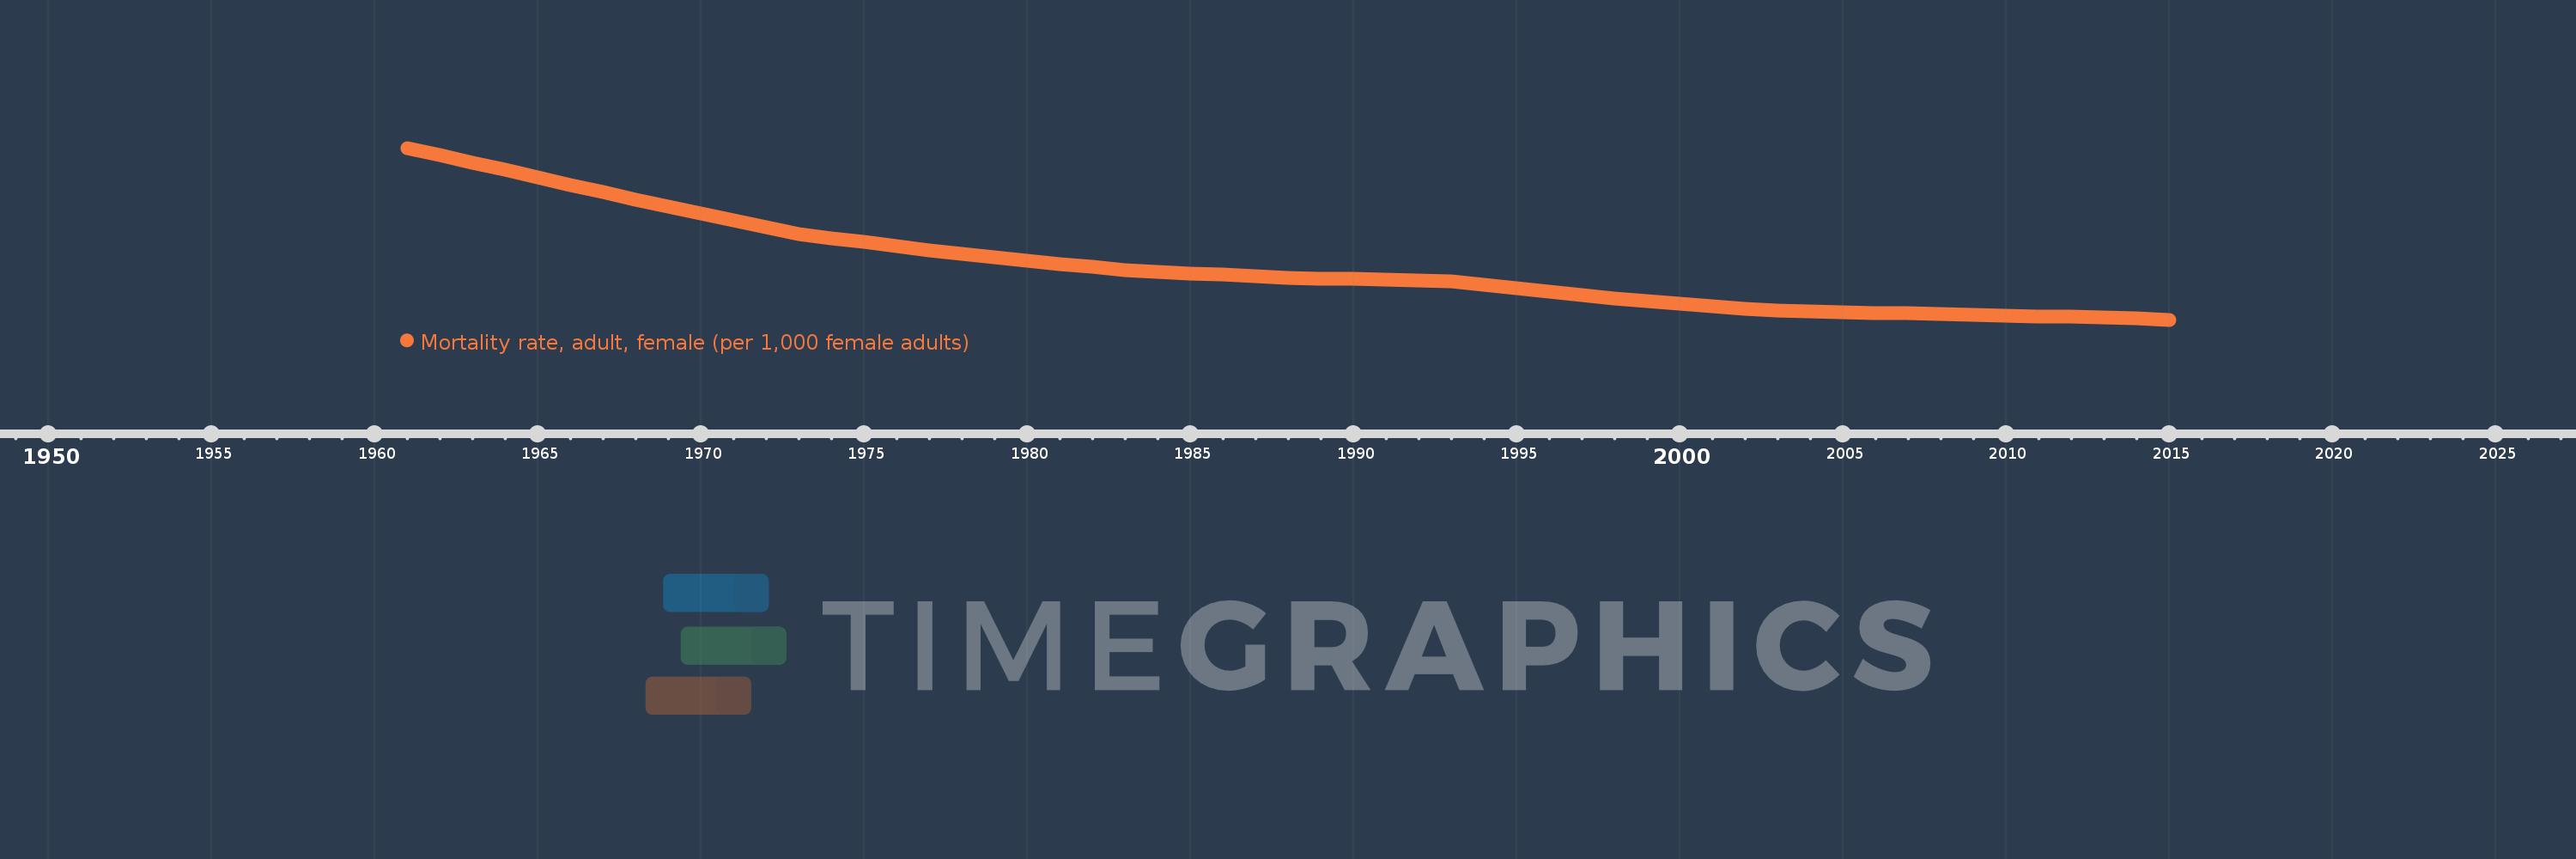
Mortality rate, adult, female (per 1,000 female adults)
2015,2014,2013,2012,2011,2010,2009,2008,2007,2006,2005,2004,2003,2002,2001,2000,1999,1998,1997,1996,1995,1994,1993,1992,1991,1990,1989,1988,1987,1986,1985,1984,1983,1982,1981,1980,1979,1978,1977,1976,1975,1974,1973,1972,1971,1970,1969,1968,1967,1966,1965,1964,1963,1962,1961
This statistics in other country:
AfghanistanAlbaniaAlgeriaAngolaAntigua and BarbudaArab WorldArgentinaArmeniaArubaAustraliaAustriaAzerbaijanBahamas, TheBahrainBangladeshBarbadosBelarusBelgiumBelizeBeninBhutanBoliviaBosnia and HerzegovinaBotswanaBrazilBrunei DarussalamBulgariaBurkina FasoBurundiCabo VerdeCambodiaCameroonCanadaCaribbean small statesCentral African RepublicCentral Europe and the BalticsChadChannel IslandsChileChinaColombiaComorosCongo, Dem. Rep.Congo, Rep.Costa RicaCote d'IvoireCroatiaCubaCuracaoCyprusCzech RepublicDenmarkDjiboutiDominicaDominican RepublicEarly-demographic dividendEast Asia & PacificEast Asia & Pacific (excluding high income)East Asia & Pacific (IDA & IBRD countries)EcuadorEgypt, Arab Rep.El SalvadorEquatorial GuineaEritreaEstoniaEthiopiaEuro areaEurope & Central AsiaEurope & Central Asia (excluding high income)Europe & Central Asia (IDA & IBRD countries)European UnionFijiFinlandFragile and conflict affected situationsFranceFrench PolynesiaGabonGambia, TheGeorgiaGermanyGhanaGreeceGreenlandGrenadaGuamGuatemalaGuineaGuinea-BissauGuyanaHaitiHeavily indebted poor countries (HIPC)High incomeHondurasHong Kong SAR, ChinaHungaryIBRD onlyIcelandIDA & IBRD totalIDA blendIDA onlyIDA totalIndiaIndonesiaIran, Islamic Rep.IraqIrelandIsraelItalyJamaicaJapanJordanKazakhstanKenyaKiribatiKorea, Dem. People’s Rep.Korea, Rep.KuwaitKyrgyz RepublicLao PDRLate-demographic dividendLatin America & Caribbean Latin America & Caribbean (excluding high income)Latin America & the Caribbean (IDA & IBRD countries)LatviaLeast developed countries: UN classificationLebanonLesothoLiberiaLibyaLithuaniaLow & middle incomeLow incomeLower middle incomeLuxembourgMacao SAR, ChinaMacedonia, FYRMadagascarMalawiMalaysiaMaldivesMaliMaltaMarshall IslandsMauritaniaMauritiusMexicoMicronesia, Fed. Sts.Middle East & North AfricaMiddle East & North Africa (excluding high income)Middle East & North Africa (IDA & IBRD countries)Middle incomeMoldovaMongoliaMontenegroMoroccoMozambiqueMyanmarNamibiaNepalNetherlandsNew CaledoniaNew ZealandNicaraguaNigerNigeriaNorth AmericaNorwayOECD membersOmanOther small statesPacific island small statesPakistanPanamaPapua New GuineaParaguayPeruPhilippinesPolandPortugalPost-demographic dividendPre-demographic dividendPuerto RicoQatarRomaniaRussian FederationRwandaSamoaSao Tome and PrincipeSaudi ArabiaSenegalSerbiaSeychellesSierra LeoneSingaporeSlovak RepublicSloveniaSmall statesSolomon IslandsSomaliaSouth AfricaSouth AsiaSouth Asia (IDA & IBRD)South SudanSpainSri LankaSt. Kitts and NevisSt. LuciaSt. Vincent and the GrenadinesSub-Saharan Africa Sub-Saharan Africa (excluding high income)Sub-Saharan Africa (IDA & IBRD countries)SudanSurinameSwazilandSwedenSwitzerlandSyrian Arab RepublicTajikistanTanzaniaThailandTimor-LesteTogoTongaTrinidad and TobagoTunisiaTurkeyTurkmenistanUgandaUkraineUnited Arab EmiratesUnited KingdomUnited StatesUpper middle incomeUruguayUzbekistanVanuatuVenezuela, RBVietnamVirgin Islands (U.S.)West Bank and GazaWorldYemen, Rep.ZambiaZimbabwe Timeline:
This timeline shows a graph from 1961 to 2015 of Venezuela, RB. No data until 1960. Number of actual observations by date: 55.
Source name:
World Development Indicators
Source organization:
(1) United Nations Population Division. World Population Prospects. New York, United Nations, Department of Economic and Social Affairs (advanced Excel tables). Available at http://esa.un.org/wpp/unpp/panel_population.htm, (2) University of California, Berkeley, and Max Planck Institute for Demographic Research. Human Mortality Database. [ www.mortality.org or www.humanmortality.de].
Categories, topics:
Health, Gender
Last updated:
apr 23, 2017
Indicators value changes by year
Minimum:
90.905
jan 1, 2015
Maximum:
250.124
jan 1, 1961
At the date of observation
Value
Absolute change
Change from previous value
jan 1, 1961
250.124
+250.124
0.0%
jan 1, 1962
243.292
-6.832
-2.73%
jan 1, 1963
236.46
-6.832
-2.81%
jan 1, 1964
229.642
-6.818
-2.88%
jan 1, 1965
222.825
-6.817
-2.97%
jan 1, 1966
216.008
-6.817
-3.06%
jan 1, 1967
209.191
-6.817
-3.16%
jan 1, 1968
202.373
-6.818
-3.26%
jan 1, 1969
195.923
-6.45
-3.19%
jan 1, 1970
189.473
-6.45
-3.29%
jan 1, 1971
183.023
-6.45
-3.4%
jan 1, 1972
176.573
-6.45
-3.52%
jan 1, 1973
170.123
-6.45
-3.65%
jan 1, 1974
166.423
-3.7
-2.17%
jan 1, 1975
162.724
-3.699
-2.22%
jan 1, 1976
159.025
-3.699
-2.27%
jan 1, 1977
155.325
-3.7
-2.33%
jan 1, 1978
151.626
-3.699
-2.38%
jan 1, 1979
148.649
-2.977
-1.96%
jan 1, 1980
145.673
-2.976
-2.0%
jan 1, 1981
142.696
-2.977
-2.04%
jan 1, 1982
139.72
-2.976
-2.09%
jan 1, 1983
136.743
-2.977
-2.13%
jan 1, 1984
135.359
-1.384
-1.01%
jan 1, 1985
133.975
-1.384
-1.02%
jan 1, 1986
132.591
-1.384
-1.03%
jan 1, 1987
131.207
-1.384
-1.04%
jan 1, 1988
129.823
-1.384
-1.05%
jan 1, 1989
129.188
-0.635
-0.49%
jan 1, 1990
128.552
-0.636
-0.49%
jan 1, 1991
127.916
-0.636
-0.49%
jan 1, 1992
127.281
-0.635
-0.5%
jan 1, 1993
126.645
-0.636
-0.5%
jan 1, 1994
123.395
-3.25
-2.57%
jan 1, 1995
120.144
-3.251
-2.63%
jan 1, 1996
116.894
-3.25
-2.71%
jan 1, 1997
113.644
-3.25
-2.78%
jan 1, 1998
110.393
-3.251
-2.86%
jan 1, 1999
108.141
-2.252
-2.04%
jan 1, 2000
105.888
-2.253
-2.08%
jan 1, 2001
103.636
-2.252
-2.13%
jan 1, 2002
101.384
-2.252
-2.17%
jan 1, 2003
99.131
-2.253
-2.22%
jan 1, 2004
98.541
-0.59
-0.6%
jan 1, 2005
97.951
-0.59
-0.6%
jan 1, 2006
97.361
-0.59
-0.6%
jan 1, 2007
96.77
-0.591
-0.61%
jan 1, 2008
96.18
-0.59
-0.61%
jan 1, 2009
95.523
-0.657
-0.68%
jan 1, 2010
94.865
-0.658
-0.69%
jan 1, 2011
94.207
-0.658
-0.69%
jan 1, 2012
93.55
-0.657
-0.7%
jan 1, 2013
92.892
-0.658
-0.7%
jan 1, 2014
91.899
-0.993
-1.07%
jan 1, 2015
90.905
-0.994
-1.08%
Ranking of countries by current statistics by years


Comments: