29
/
en
AIzaSyAYiBZKx7MnpbEhh9jyipgxe19OcubqV5w
April 1, 2024
257584
Switzerland
CHE
true
2
1
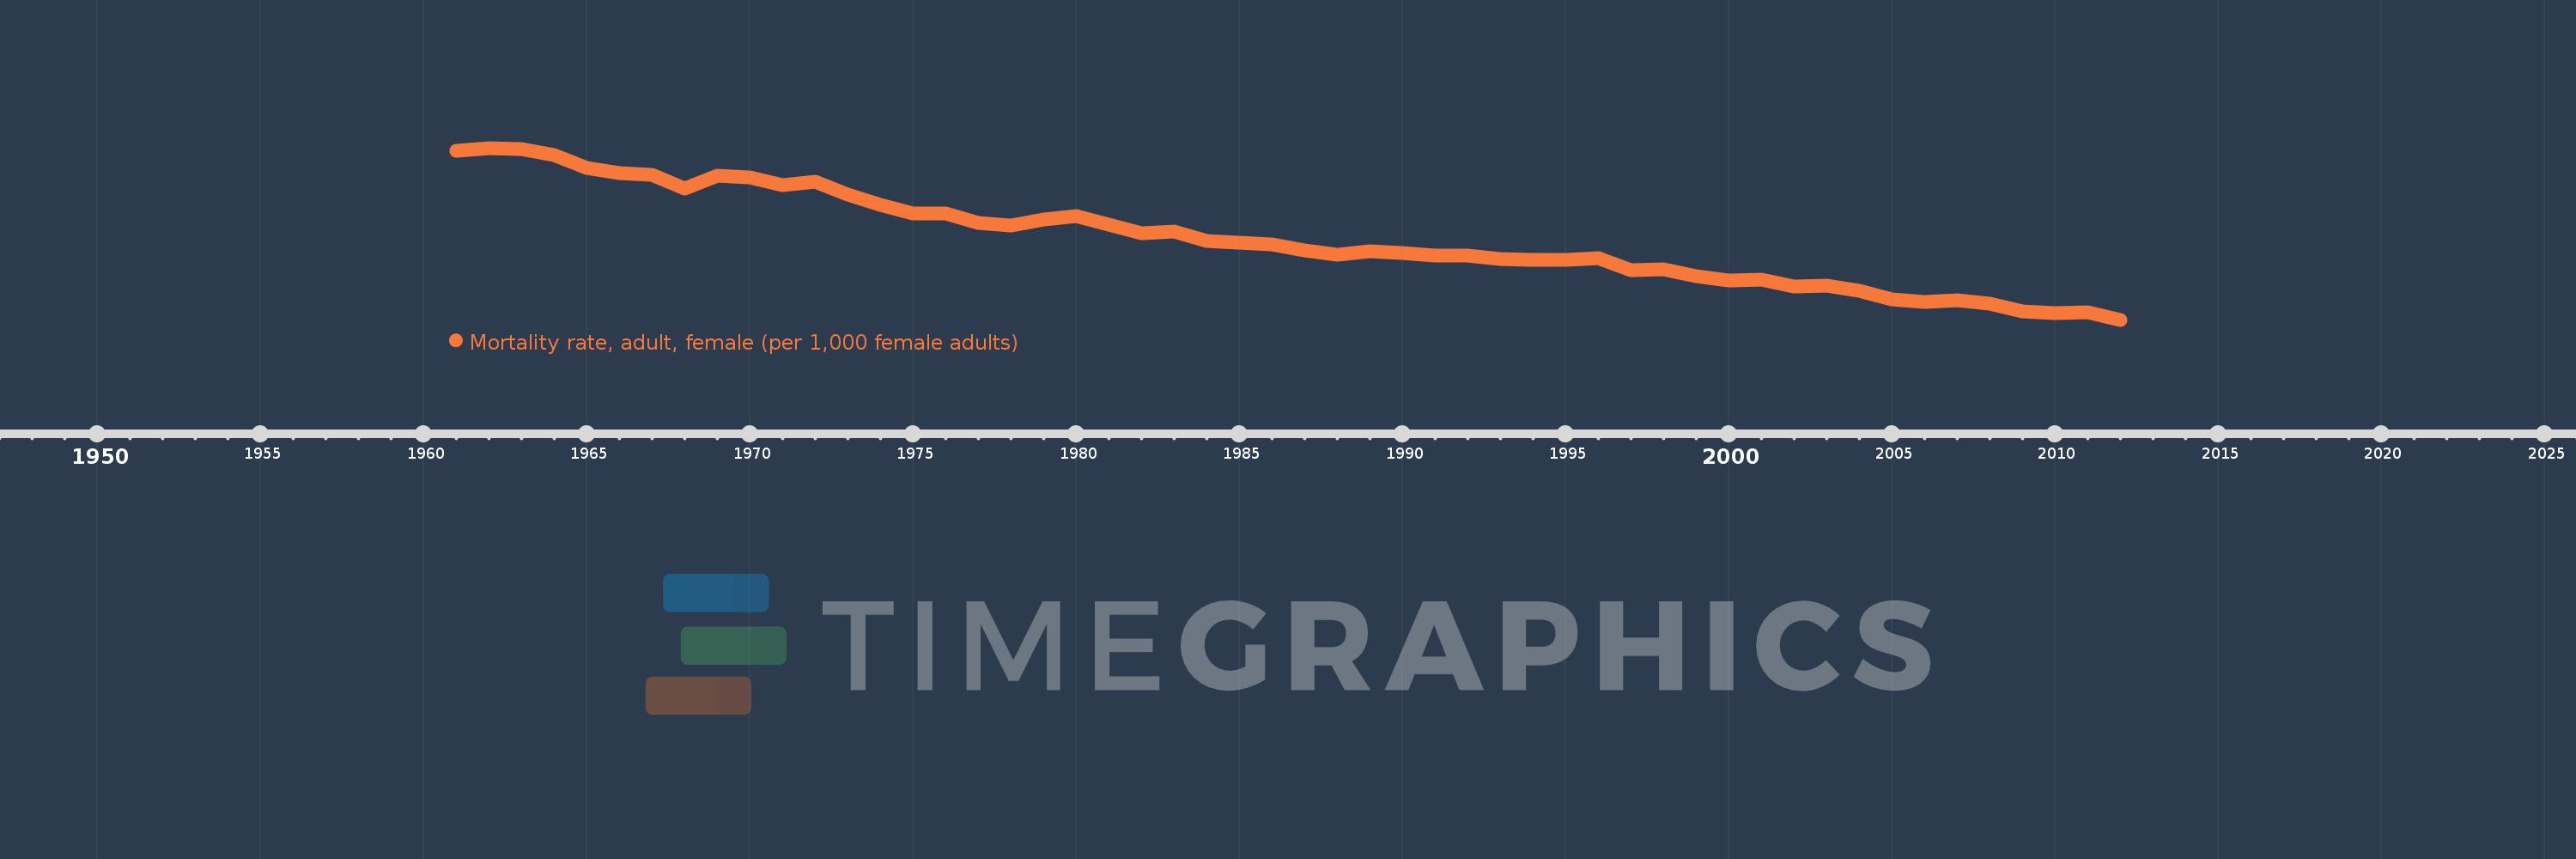
Mortality rate, adult, female (per 1,000 female adults)
2012,2011,2010,2009,2008,2007,2006,2005,2004,2003,2002,2001,2000,1999,1998,1997,1996,1995,1994,1993,1992,1991,1990,1989,1988,1987,1986,1985,1984,1983,1982,1981,1980,1979,1978,1977,1976,1975,1974,1973,1972,1971,1970,1969,1968,1967,1966,1965,1964,1963,1962,1961
This statistics in other country:
AfghanistanAlbaniaAlgeriaAngolaAntigua and BarbudaArab WorldArgentinaArmeniaArubaAustraliaAustriaAzerbaijanBahamas, TheBahrainBangladeshBarbadosBelarusBelgiumBelizeBeninBhutanBoliviaBosnia and HerzegovinaBotswanaBrazilBrunei DarussalamBulgariaBurkina FasoBurundiCabo VerdeCambodiaCameroonCanadaCaribbean small statesCentral African RepublicCentral Europe and the BalticsChadChannel IslandsChileChinaColombiaComorosCongo, Dem. Rep.Congo, Rep.Costa RicaCote d'IvoireCroatiaCubaCuracaoCyprusCzech RepublicDenmarkDjiboutiDominicaDominican RepublicEarly-demographic dividendEast Asia & PacificEast Asia & Pacific (excluding high income)East Asia & Pacific (IDA & IBRD countries)EcuadorEgypt, Arab Rep.El SalvadorEquatorial GuineaEritreaEstoniaEthiopiaEuro areaEurope & Central AsiaEurope & Central Asia (excluding high income)Europe & Central Asia (IDA & IBRD countries)European UnionFijiFinlandFragile and conflict affected situationsFranceFrench PolynesiaGabonGambia, TheGeorgiaGermanyGhanaGreeceGreenlandGrenadaGuamGuatemalaGuineaGuinea-BissauGuyanaHaitiHeavily indebted poor countries (HIPC)High incomeHondurasHong Kong SAR, ChinaHungaryIBRD onlyIcelandIDA & IBRD totalIDA blendIDA onlyIDA totalIndiaIndonesiaIran, Islamic Rep.IraqIrelandIsraelItalyJamaicaJapanJordanKazakhstanKenyaKiribatiKorea, Dem. People’s Rep.Korea, Rep.KuwaitKyrgyz RepublicLao PDRLate-demographic dividendLatin America & Caribbean Latin America & Caribbean (excluding high income)Latin America & the Caribbean (IDA & IBRD countries)LatviaLeast developed countries: UN classificationLebanonLesothoLiberiaLibyaLithuaniaLow & middle incomeLow incomeLower middle incomeLuxembourgMacao SAR, ChinaMacedonia, FYRMadagascarMalawiMalaysiaMaldivesMaliMaltaMarshall IslandsMauritaniaMauritiusMexicoMicronesia, Fed. Sts.Middle East & North AfricaMiddle East & North Africa (excluding high income)Middle East & North Africa (IDA & IBRD countries)Middle incomeMoldovaMongoliaMontenegroMoroccoMozambiqueMyanmarNamibiaNepalNetherlandsNew CaledoniaNew ZealandNicaraguaNigerNigeriaNorth AmericaNorwayOECD membersOmanOther small statesPacific island small statesPakistanPanamaPapua New GuineaParaguayPeruPhilippinesPolandPortugalPost-demographic dividendPre-demographic dividendPuerto RicoQatarRomaniaRussian FederationRwandaSamoaSao Tome and PrincipeSaudi ArabiaSenegalSerbiaSeychellesSierra LeoneSingaporeSlovak RepublicSloveniaSmall statesSolomon IslandsSomaliaSouth AfricaSouth AsiaSouth Asia (IDA & IBRD)South SudanSpainSri LankaSt. Kitts and NevisSt. LuciaSt. Vincent and the GrenadinesSub-Saharan Africa Sub-Saharan Africa (excluding high income)Sub-Saharan Africa (IDA & IBRD countries)SudanSurinameSwazilandSwedenSwitzerlandSyrian Arab RepublicTajikistanTanzaniaThailandTimor-LesteTogoTongaTrinidad and TobagoTunisiaTurkeyTurkmenistanUgandaUkraineUnited Arab EmiratesUnited KingdomUnited StatesUpper middle incomeUruguayUzbekistanVanuatuVenezuela, RBVietnamVirgin Islands (U.S.)West Bank and GazaWorldYemen, Rep.ZambiaZimbabwe Timeline:
This timeline shows a graph from 1961 to 2012 of Switzerland. No data until 1960. Number of actual observations by date: 52.
Source name:
World Development Indicators
Source organization:
(1) United Nations Population Division. World Population Prospects. New York, United Nations, Department of Economic and Social Affairs (advanced Excel tables). Available at http://esa.un.org/wpp/unpp/panel_population.htm, (2) University of California, Berkeley, and Max Planck Institute for Demographic Research. Human Mortality Database. [ www.mortality.org or www.humanmortality.de].
Categories, topics:
Health, Gender
Last updated:
apr 23, 2017
Indicators value changes by year
Minimum:
40.007
jan 1, 2012
Maximum:
100.093
jan 1, 1962
At the date of observation
Value
Absolute change
Change from previous value
jan 1, 1961
98.981
+98.981
0.0%
jan 1, 1962
100.093
+1.112
1.12%
jan 1, 1963
99.663
-0.43
-0.43%
jan 1, 1964
97.736
-1.927
-1.93%
jan 1, 1965
93.008
-4.728
-4.84%
jan 1, 1966
91.257
-1.751
-1.88%
jan 1, 1967
90.672
-0.585
-0.64%
jan 1, 1968
85.98
-4.692
-5.17%
jan 1, 1969
90.428
+4.448
5.17%
jan 1, 1970
89.845
-0.583
-0.64%
jan 1, 1971
87.015
-2.83
-3.15%
jan 1, 1972
88.204
+1.189
1.37%
jan 1, 1973
83.889
-4.315
-4.89%
jan 1, 1974
80.194
-3.695
-4.4%
jan 1, 1975
77.258
-2.936
-3.66%
jan 1, 1976
77.06
-0.198
-0.26%
jan 1, 1977
73.856
-3.204
-4.16%
jan 1, 1978
72.893
-0.963
-1.3%
jan 1, 1979
74.922
+2.029
2.78%
jan 1, 1980
76.227
+1.305
1.74%
jan 1, 1981
73.205
-3.022
-3.96%
jan 1, 1982
70.269
-2.936
-4.01%
jan 1, 1983
70.892
+0.623
0.89%
jan 1, 1984
67.407
-3.485
-4.92%
jan 1, 1985
67.017
-0.39
-0.58%
jan 1, 1986
66.314
-0.703
-1.05%
jan 1, 1987
64.295
-2.019
-3.04%
jan 1, 1988
62.702
-1.593
-2.48%
jan 1, 1989
63.822
+1.12
1.79%
jan 1, 1990
63.499
-0.323
-0.51%
jan 1, 1991
62.353
-1.146
-1.8%
jan 1, 1992
62.439
+0.086
0.14%
jan 1, 1993
61.173
-1.266
-2.03%
jan 1, 1994
60.871
-0.302
-0.49%
jan 1, 1995
61.014
+0.143
0.23%
jan 1, 1996
61.455
+0.441
0.72%
jan 1, 1997
57.405
-4.05
-6.59%
jan 1, 1998
57.531
+0.126
0.22%
jan 1, 1999
55.189
-2.342
-4.07%
jan 1, 2000
53.659
-1.53
-2.77%
jan 1, 2001
53.925
+0.266
0.5%
jan 1, 2002
51.73
-2.195
-4.07%
jan 1, 2003
51.994
+0.264
0.51%
jan 1, 2004
50.217
-1.777
-3.42%
jan 1, 2005
47.119
-3.098
-6.17%
jan 1, 2006
46.192
-0.927
-1.97%
jan 1, 2007
46.842
+0.65
1.41%
jan 1, 2008
45.6
-1.242
-2.65%
jan 1, 2009
42.92
-2.68
-5.88%
jan 1, 2010
42.246
-0.674
-1.57%
jan 1, 2011
42.582
+0.336
0.8%
jan 1, 2012
40.007
-2.575
-6.05%
Ranking of countries by current statistics by years


Comments: