29
/
en
AIzaSyAYiBZKx7MnpbEhh9jyipgxe19OcubqV5w
April 1, 2024
115095
Croatia
HRV
true
2
1
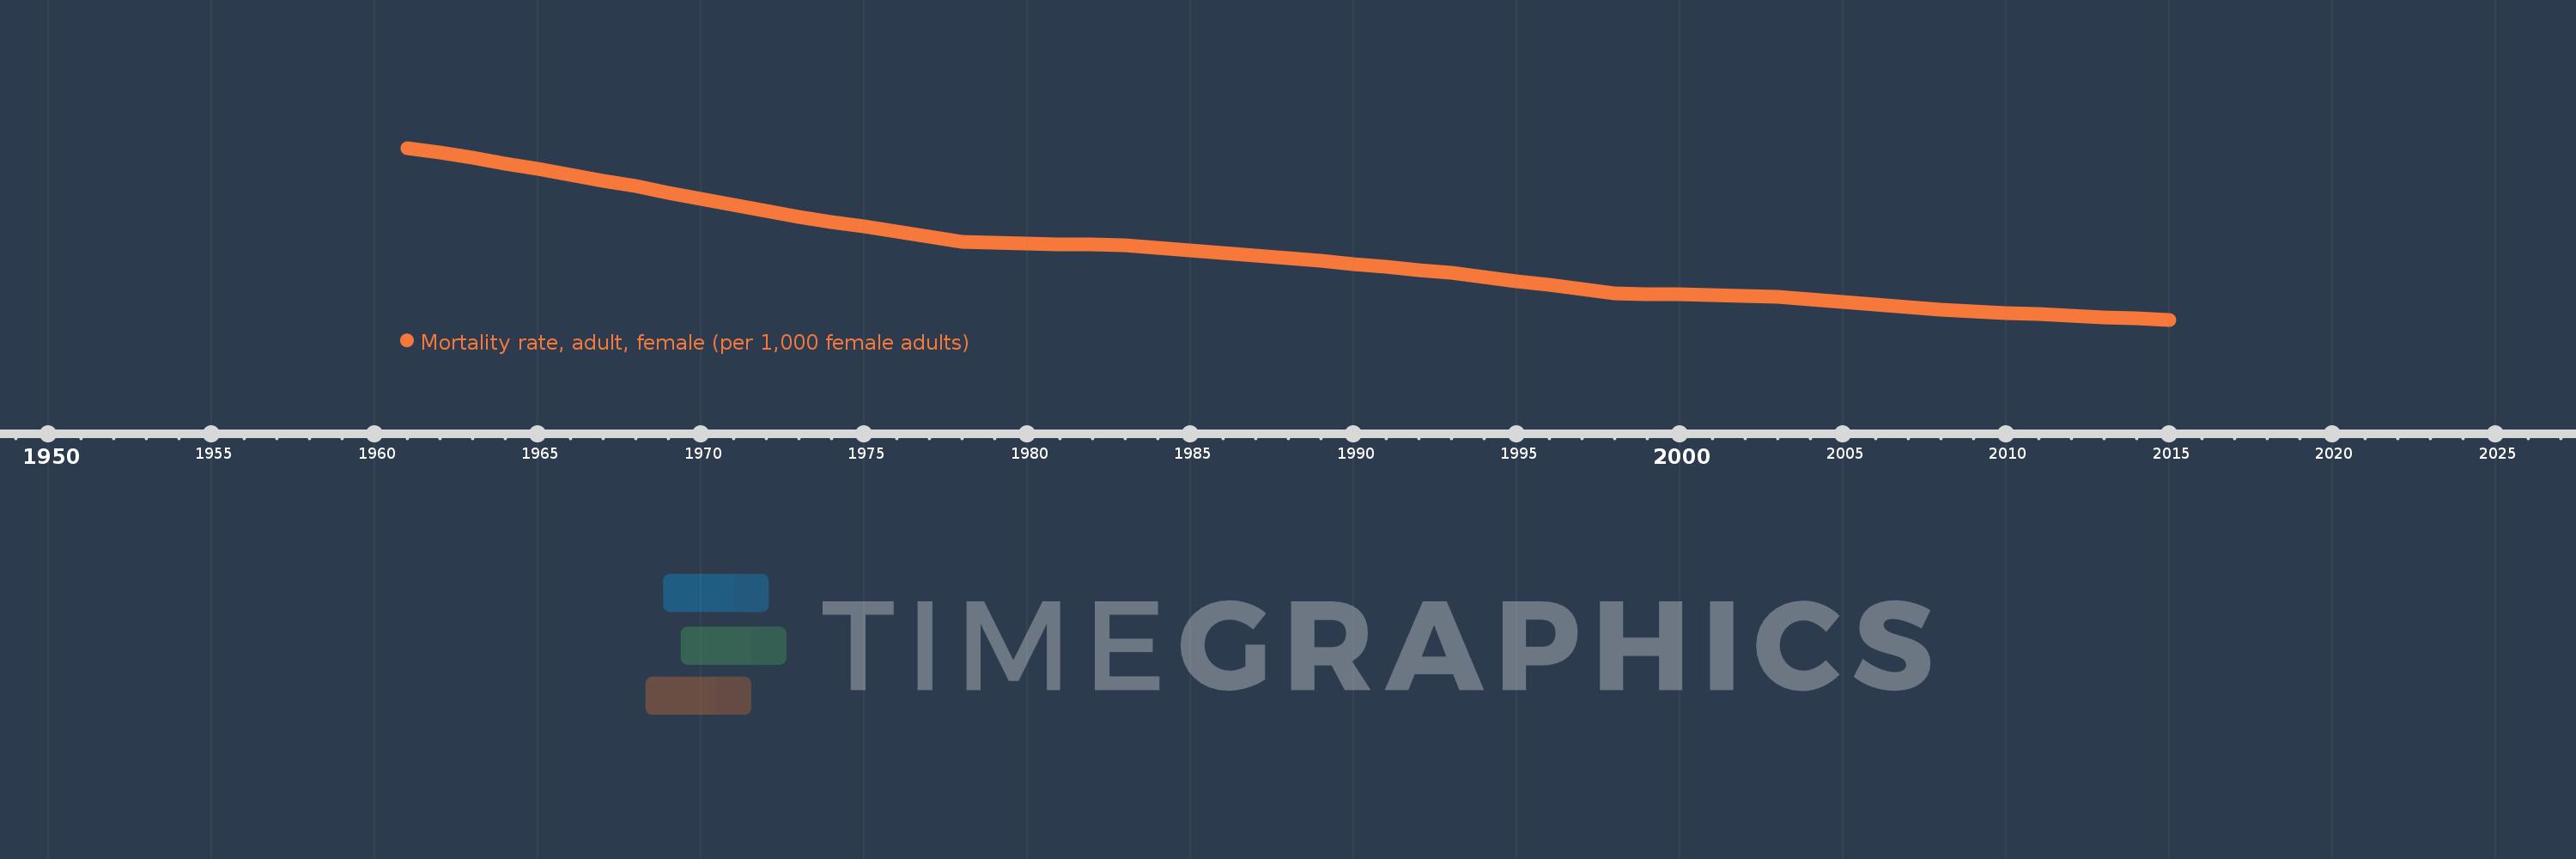
Mortality rate, adult, female (per 1,000 female adults)
2015,2014,2013,2012,2011,2010,2009,2008,2007,2006,2005,2004,2003,2002,2001,2000,1999,1998,1997,1996,1995,1994,1993,1992,1991,1990,1989,1988,1987,1986,1985,1984,1983,1982,1981,1980,1979,1978,1977,1976,1975,1974,1973,1972,1971,1970,1969,1968,1967,1966,1965,1964,1963,1962,1961
This statistics in other country:
AfghanistanAlbaniaAlgeriaAngolaAntigua and BarbudaArab WorldArgentinaArmeniaArubaAustraliaAustriaAzerbaijanBahamas, TheBahrainBangladeshBarbadosBelarusBelgiumBelizeBeninBhutanBoliviaBosnia and HerzegovinaBotswanaBrazilBrunei DarussalamBulgariaBurkina FasoBurundiCabo VerdeCambodiaCameroonCanadaCaribbean small statesCentral African RepublicCentral Europe and the BalticsChadChannel IslandsChileChinaColombiaComorosCongo, Dem. Rep.Congo, Rep.Costa RicaCote d'IvoireCroatiaCubaCuracaoCyprusCzech RepublicDenmarkDjiboutiDominicaDominican RepublicEarly-demographic dividendEast Asia & PacificEast Asia & Pacific (excluding high income)East Asia & Pacific (IDA & IBRD countries)EcuadorEgypt, Arab Rep.El SalvadorEquatorial GuineaEritreaEstoniaEthiopiaEuro areaEurope & Central AsiaEurope & Central Asia (excluding high income)Europe & Central Asia (IDA & IBRD countries)European UnionFijiFinlandFragile and conflict affected situationsFranceFrench PolynesiaGabonGambia, TheGeorgiaGermanyGhanaGreeceGreenlandGrenadaGuamGuatemalaGuineaGuinea-BissauGuyanaHaitiHeavily indebted poor countries (HIPC)High incomeHondurasHong Kong SAR, ChinaHungaryIBRD onlyIcelandIDA & IBRD totalIDA blendIDA onlyIDA totalIndiaIndonesiaIran, Islamic Rep.IraqIrelandIsraelItalyJamaicaJapanJordanKazakhstanKenyaKiribatiKorea, Dem. People’s Rep.Korea, Rep.KuwaitKyrgyz RepublicLao PDRLate-demographic dividendLatin America & Caribbean Latin America & Caribbean (excluding high income)Latin America & the Caribbean (IDA & IBRD countries)LatviaLeast developed countries: UN classificationLebanonLesothoLiberiaLibyaLithuaniaLow & middle incomeLow incomeLower middle incomeLuxembourgMacao SAR, ChinaMacedonia, FYRMadagascarMalawiMalaysiaMaldivesMaliMaltaMarshall IslandsMauritaniaMauritiusMexicoMicronesia, Fed. Sts.Middle East & North AfricaMiddle East & North Africa (excluding high income)Middle East & North Africa (IDA & IBRD countries)Middle incomeMoldovaMongoliaMontenegroMoroccoMozambiqueMyanmarNamibiaNepalNetherlandsNew CaledoniaNew ZealandNicaraguaNigerNigeriaNorth AmericaNorwayOECD membersOmanOther small statesPacific island small statesPakistanPanamaPapua New GuineaParaguayPeruPhilippinesPolandPortugalPost-demographic dividendPre-demographic dividendPuerto RicoQatarRomaniaRussian FederationRwandaSamoaSao Tome and PrincipeSaudi ArabiaSenegalSerbiaSeychellesSierra LeoneSingaporeSlovak RepublicSloveniaSmall statesSolomon IslandsSomaliaSouth AfricaSouth AsiaSouth Asia (IDA & IBRD)South SudanSpainSri LankaSt. Kitts and NevisSt. LuciaSt. Vincent and the GrenadinesSub-Saharan Africa Sub-Saharan Africa (excluding high income)Sub-Saharan Africa (IDA & IBRD countries)SudanSurinameSwazilandSwedenSwitzerlandSyrian Arab RepublicTajikistanTanzaniaThailandTimor-LesteTogoTongaTrinidad and TobagoTunisiaTurkeyTurkmenistanUgandaUkraineUnited Arab EmiratesUnited KingdomUnited StatesUpper middle incomeUruguayUzbekistanVanuatuVenezuela, RBVietnamVirgin Islands (U.S.)West Bank and GazaWorldYemen, Rep.ZambiaZimbabwe Timeline:
This timeline shows a graph from 1961 to 2015 of Croatia. No data until 1960. Number of actual observations by date: 55.
Source name:
World Development Indicators
Source organization:
(1) United Nations Population Division. World Population Prospects. New York, United Nations, Department of Economic and Social Affairs (advanced Excel tables). Available at http://esa.un.org/wpp/unpp/panel_population.htm, (2) University of California, Berkeley, and Max Planck Institute for Demographic Research. Human Mortality Database. [ www.mortality.org or www.humanmortality.de].
Categories, topics:
Health, Gender
Last updated:
apr 23, 2017
Indicators value changes by year
Minimum:
56.891
jan 1, 2015
Maximum:
155.916
jan 1, 1961
At the date of observation
Value
Absolute change
Change from previous value
jan 1, 1961
155.916
+155.916
0.0%
jan 1, 1962
153.09
-2.826
-1.81%
jan 1, 1963
150.263
-2.827
-1.85%
jan 1, 1964
146.958
-3.305
-2.2%
jan 1, 1965
143.652
-3.306
-2.25%
jan 1, 1966
140.347
-3.305
-2.3%
jan 1, 1967
137.041
-3.306
-2.36%
jan 1, 1968
133.736
-3.305
-2.41%
jan 1, 1969
130.254
-3.482
-2.6%
jan 1, 1970
126.773
-3.481
-2.67%
jan 1, 1971
123.291
-3.482
-2.75%
jan 1, 1972
119.809
-3.482
-2.82%
jan 1, 1973
116.328
-3.481
-2.91%
jan 1, 1974
113.403
-2.925
-2.51%
jan 1, 1975
110.478
-2.925
-2.58%
jan 1, 1976
107.554
-2.924
-2.65%
jan 1, 1977
104.629
-2.925
-2.72%
jan 1, 1978
101.704
-2.925
-2.8%
jan 1, 1979
101.298
-0.406
-0.4%
jan 1, 1980
100.891
-0.407
-0.4%
jan 1, 1981
100.484
-0.407
-0.4%
jan 1, 1982
100.077
-0.407
-0.41%
jan 1, 1983
99.67
-0.407
-0.41%
jan 1, 1984
98.228
-1.442
-1.45%
jan 1, 1985
96.786
-1.442
-1.47%
jan 1, 1986
95.344
-1.442
-1.49%
jan 1, 1987
93.902
-1.442
-1.51%
jan 1, 1988
92.46
-1.442
-1.54%
jan 1, 1989
90.739
-1.721
-1.86%
jan 1, 1990
89.019
-1.72
-1.9%
jan 1, 1991
87.298
-1.721
-1.93%
jan 1, 1992
85.577
-1.721
-1.97%
jan 1, 1993
83.856
-1.721
-2.01%
jan 1, 1994
81.539
-2.317
-2.76%
jan 1, 1995
79.222
-2.317
-2.84%
jan 1, 1996
76.905
-2.317
-2.92%
jan 1, 1997
74.588
-2.317
-3.01%
jan 1, 1998
72.271
-2.317
-3.11%
jan 1, 1999
71.831
-0.44
-0.61%
jan 1, 2000
71.391
-0.44
-0.61%
jan 1, 2001
70.95
-0.441
-0.62%
jan 1, 2002
70.51
-0.44
-0.62%
jan 1, 2003
70.07
-0.44
-0.62%
jan 1, 2004
68.547
-1.523
-2.17%
jan 1, 2005
67.024
-1.523
-2.22%
jan 1, 2006
65.5
-1.524
-2.27%
jan 1, 2007
63.977
-1.523
-2.33%
jan 1, 2008
62.454
-1.523
-2.38%
jan 1, 2009
61.645
-0.809
-1.3%
jan 1, 2010
60.835
-0.81
-1.31%
jan 1, 2011
60.026
-0.809
-1.33%
jan 1, 2012
59.217
-0.809
-1.35%
jan 1, 2013
58.408
-0.809
-1.37%
jan 1, 2014
57.649
-0.759
-1.3%
jan 1, 2015
56.891
-0.758
-1.31%
Ranking of countries by current statistics by years


Comments: