29
/
en
AIzaSyAYiBZKx7MnpbEhh9jyipgxe19OcubqV5w
April 1, 2024
221153
Paraguay
PRY
true
2
1
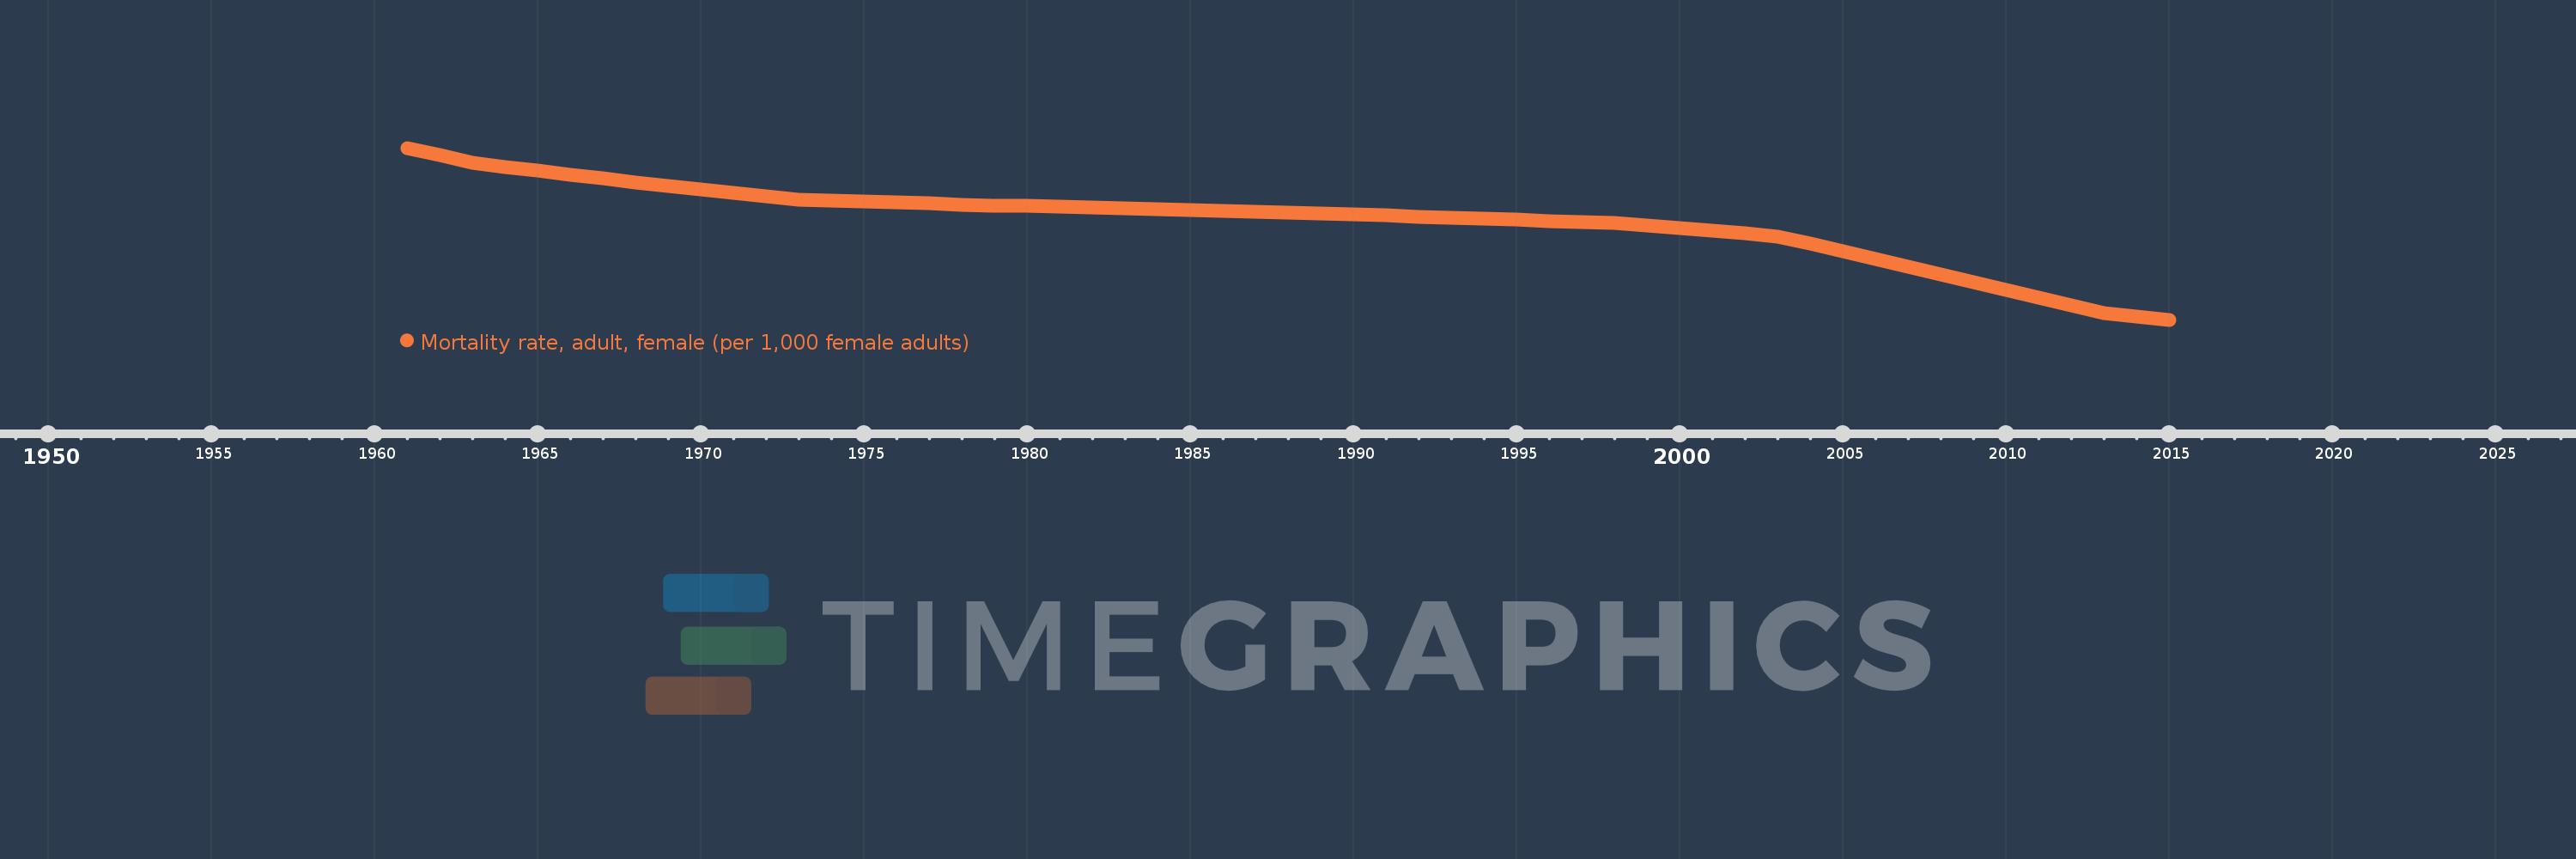
Mortality rate, adult, female (per 1,000 female adults)
2015,2014,2013,2012,2011,2010,2009,2008,2007,2006,2005,2004,2003,2002,2001,2000,1999,1998,1997,1996,1995,1994,1993,1992,1991,1990,1989,1988,1987,1986,1985,1984,1983,1982,1981,1980,1979,1978,1977,1976,1975,1974,1973,1972,1971,1970,1969,1968,1967,1966,1965,1964,1963,1962,1961
This statistics in other country:
AfghanistanAlbaniaAlgeriaAngolaAntigua and BarbudaArab WorldArgentinaArmeniaArubaAustraliaAustriaAzerbaijanBahamas, TheBahrainBangladeshBarbadosBelarusBelgiumBelizeBeninBhutanBoliviaBosnia and HerzegovinaBotswanaBrazilBrunei DarussalamBulgariaBurkina FasoBurundiCabo VerdeCambodiaCameroonCanadaCaribbean small statesCentral African RepublicCentral Europe and the BalticsChadChannel IslandsChileChinaColombiaComorosCongo, Dem. Rep.Congo, Rep.Costa RicaCote d'IvoireCroatiaCubaCuracaoCyprusCzech RepublicDenmarkDjiboutiDominicaDominican RepublicEarly-demographic dividendEast Asia & PacificEast Asia & Pacific (excluding high income)East Asia & Pacific (IDA & IBRD countries)EcuadorEgypt, Arab Rep.El SalvadorEquatorial GuineaEritreaEstoniaEthiopiaEuro areaEurope & Central AsiaEurope & Central Asia (excluding high income)Europe & Central Asia (IDA & IBRD countries)European UnionFijiFinlandFragile and conflict affected situationsFranceFrench PolynesiaGabonGambia, TheGeorgiaGermanyGhanaGreeceGreenlandGrenadaGuamGuatemalaGuineaGuinea-BissauGuyanaHaitiHeavily indebted poor countries (HIPC)High incomeHondurasHong Kong SAR, ChinaHungaryIBRD onlyIcelandIDA & IBRD totalIDA blendIDA onlyIDA totalIndiaIndonesiaIran, Islamic Rep.IraqIrelandIsraelItalyJamaicaJapanJordanKazakhstanKenyaKiribatiKorea, Dem. People’s Rep.Korea, Rep.KuwaitKyrgyz RepublicLao PDRLate-demographic dividendLatin America & Caribbean Latin America & Caribbean (excluding high income)Latin America & the Caribbean (IDA & IBRD countries)LatviaLeast developed countries: UN classificationLebanonLesothoLiberiaLibyaLithuaniaLow & middle incomeLow incomeLower middle incomeLuxembourgMacao SAR, ChinaMacedonia, FYRMadagascarMalawiMalaysiaMaldivesMaliMaltaMarshall IslandsMauritaniaMauritiusMexicoMicronesia, Fed. Sts.Middle East & North AfricaMiddle East & North Africa (excluding high income)Middle East & North Africa (IDA & IBRD countries)Middle incomeMoldovaMongoliaMontenegroMoroccoMozambiqueMyanmarNamibiaNepalNetherlandsNew CaledoniaNew ZealandNicaraguaNigerNigeriaNorth AmericaNorwayOECD membersOmanOther small statesPacific island small statesPakistanPanamaPapua New GuineaParaguayPeruPhilippinesPolandPortugalPost-demographic dividendPre-demographic dividendPuerto RicoQatarRomaniaRussian FederationRwandaSamoaSao Tome and PrincipeSaudi ArabiaSenegalSerbiaSeychellesSierra LeoneSingaporeSlovak RepublicSloveniaSmall statesSolomon IslandsSomaliaSouth AfricaSouth AsiaSouth Asia (IDA & IBRD)South SudanSpainSri LankaSt. Kitts and NevisSt. LuciaSt. Vincent and the GrenadinesSub-Saharan Africa Sub-Saharan Africa (excluding high income)Sub-Saharan Africa (IDA & IBRD countries)SudanSurinameSwazilandSwedenSwitzerlandSyrian Arab RepublicTajikistanTanzaniaThailandTimor-LesteTogoTongaTrinidad and TobagoTunisiaTurkeyTurkmenistanUgandaUkraineUnited Arab EmiratesUnited KingdomUnited StatesUpper middle incomeUruguayUzbekistanVanuatuVenezuela, RBVietnamVirgin Islands (U.S.)West Bank and GazaWorldYemen, Rep.ZambiaZimbabwe Timeline:
This timeline shows a graph from 1961 to 2015 of Paraguay. No data until 1960. Number of actual observations by date: 55.
Source name:
World Development Indicators
Source organization:
(1) United Nations Population Division. World Population Prospects. New York, United Nations, Department of Economic and Social Affairs (advanced Excel tables). Available at http://esa.un.org/wpp/unpp/panel_population.htm, (2) University of California, Berkeley, and Max Planck Institute for Demographic Research. Human Mortality Database. [ www.mortality.org or www.humanmortality.de].
Categories, topics:
Health, Gender
Last updated:
apr 23, 2017
Indicators value changes by year
Minimum:
126.134
jan 1, 2015
Maximum:
164.407
jan 1, 1961
At the date of observation
Value
Absolute change
Change from previous value
jan 1, 1961
164.407
+164.407
0.0%
jan 1, 1962
162.745
-1.662
-1.01%
jan 1, 1963
161.082
-1.663
-1.02%
jan 1, 1964
160.223
-0.859
-0.53%
jan 1, 1965
159.363
-0.86
-0.54%
jan 1, 1966
158.504
-0.859
-0.54%
jan 1, 1967
157.645
-0.859
-0.54%
jan 1, 1968
156.786
-0.859
-0.54%
jan 1, 1969
155.993
-0.793
-0.51%
jan 1, 1970
155.201
-0.792
-0.51%
jan 1, 1971
154.409
-0.792
-0.51%
jan 1, 1972
153.616
-0.793
-0.51%
jan 1, 1973
152.824
-0.792
-0.52%
jan 1, 1974
152.62
-0.204
-0.13%
jan 1, 1975
152.416
-0.204
-0.13%
jan 1, 1976
152.212
-0.204
-0.13%
jan 1, 1977
152.008
-0.204
-0.13%
jan 1, 1978
151.804
-0.204
-0.13%
jan 1, 1979
151.622
-0.182
-0.12%
jan 1, 1980
151.44
-0.182
-0.12%
jan 1, 1981
151.259
-0.181
-0.12%
jan 1, 1982
151.077
-0.182
-0.12%
jan 1, 1983
150.895
-0.182
-0.12%
jan 1, 1984
150.729
-0.166
-0.11%
jan 1, 1985
150.564
-0.165
-0.11%
jan 1, 1986
150.398
-0.166
-0.11%
jan 1, 1987
150.233
-0.165
-0.11%
jan 1, 1988
150.067
-0.166
-0.11%
jan 1, 1989
149.822
-0.245
-0.16%
jan 1, 1990
149.577
-0.245
-0.16%
jan 1, 1991
149.332
-0.245
-0.16%
jan 1, 1992
149.087
-0.245
-0.16%
jan 1, 1993
148.842
-0.245
-0.16%
jan 1, 1994
148.615
-0.227
-0.15%
jan 1, 1995
148.389
-0.226
-0.15%
jan 1, 1996
148.162
-0.227
-0.15%
jan 1, 1997
147.935
-0.227
-0.15%
jan 1, 1998
147.709
-0.226
-0.15%
jan 1, 1999
147.112
-0.597
-0.4%
jan 1, 2000
146.515
-0.597
-0.41%
jan 1, 2001
145.919
-0.596
-0.41%
jan 1, 2002
145.322
-0.597
-0.41%
jan 1, 2003
144.725
-0.597
-0.41%
jan 1, 2004
143.015
-1.71
-1.18%
jan 1, 2005
141.304
-1.711
-1.2%
jan 1, 2006
139.594
-1.71
-1.21%
jan 1, 2007
137.883
-1.711
-1.23%
jan 1, 2008
136.173
-1.71
-1.24%
jan 1, 2009
134.471
-1.702
-1.25%
jan 1, 2010
132.769
-1.702
-1.27%
jan 1, 2011
131.067
-1.702
-1.28%
jan 1, 2012
129.365
-1.702
-1.3%
jan 1, 2013
127.663
-1.702
-1.32%
jan 1, 2014
126.899
-0.764
-0.6%
jan 1, 2015
126.134
-0.765
-0.6%
Ranking of countries by current statistics by years


Comments: