29
/
en
AIzaSyAYiBZKx7MnpbEhh9jyipgxe19OcubqV5w
April 1, 2024
82025
Belgium
BEL
true
2
1
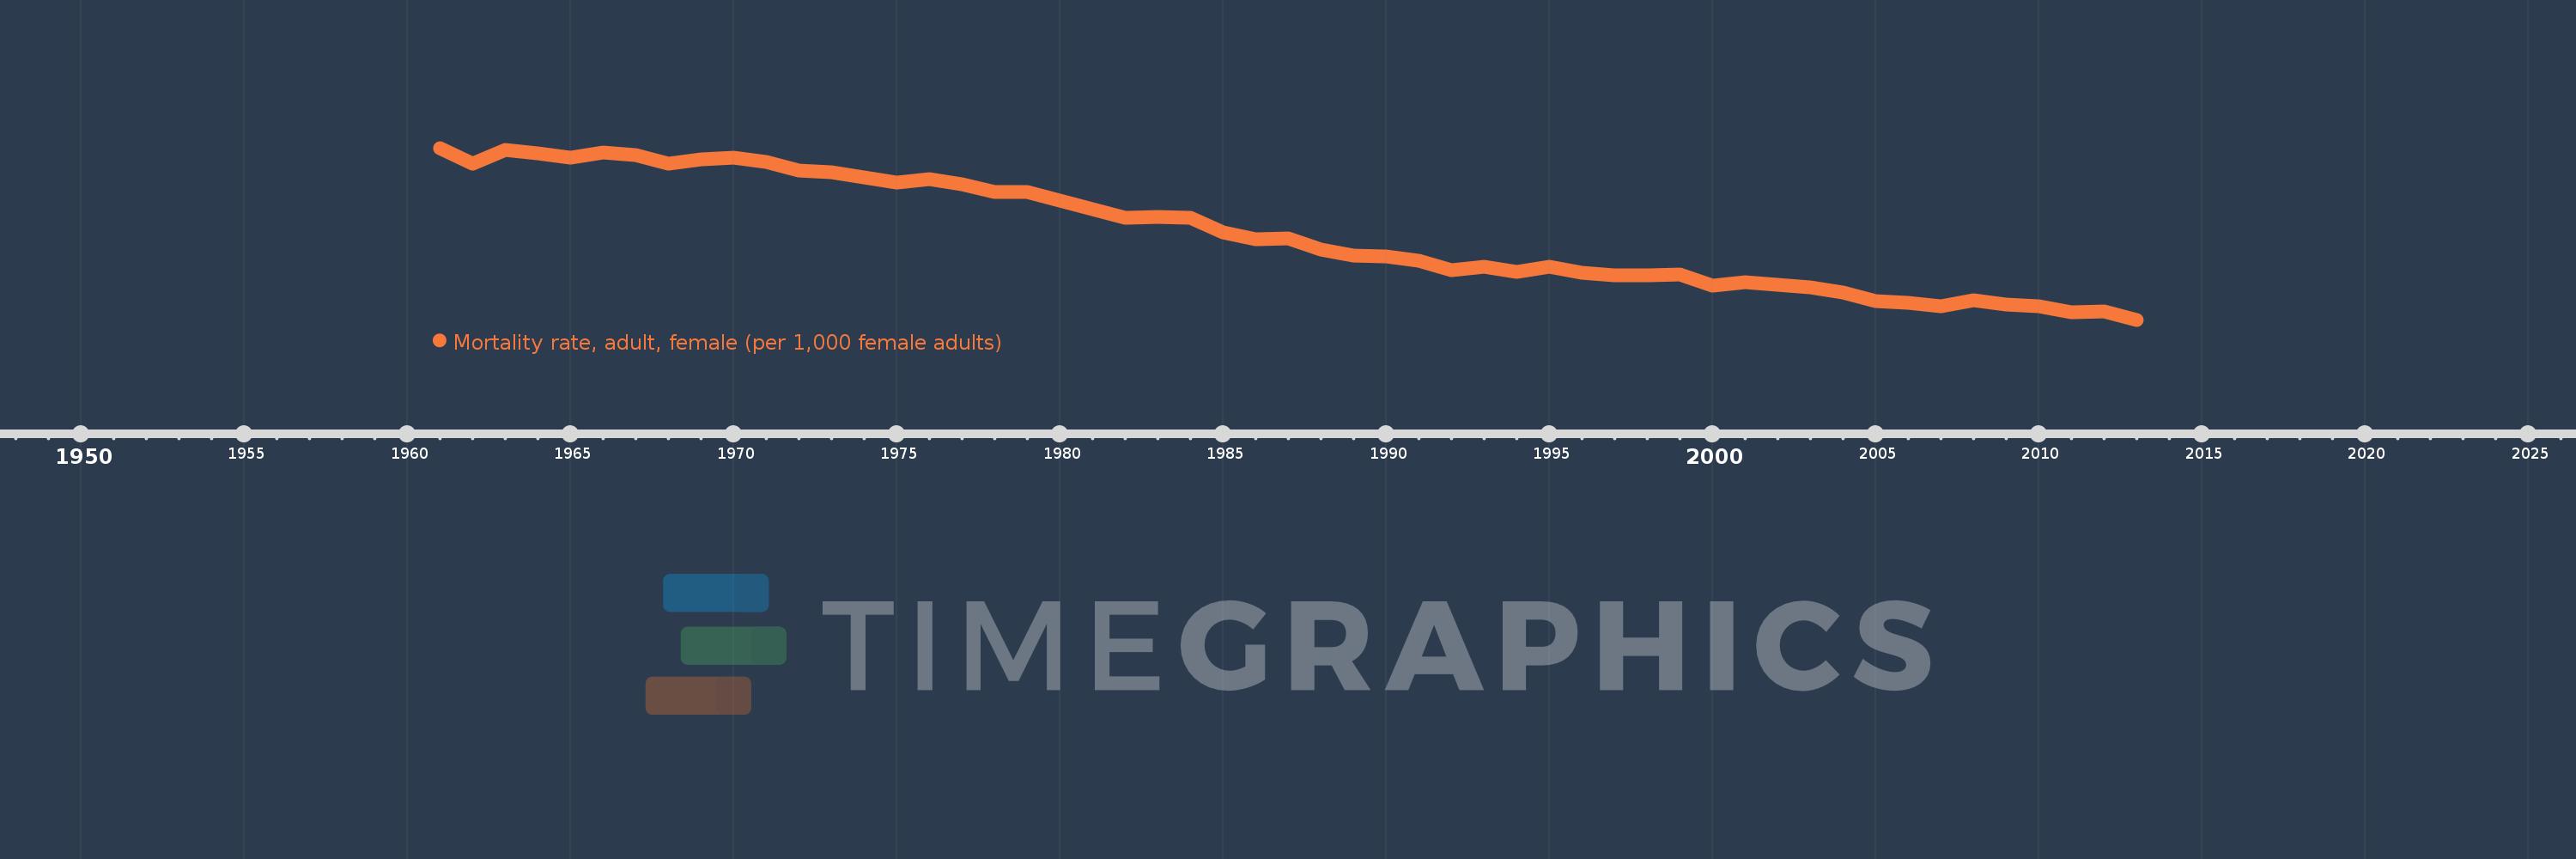
Mortality rate, adult, female (per 1,000 female adults)
2013,2012,2011,2010,2009,2008,2007,2006,2005,2004,2003,2002,2001,2000,1999,1998,1997,1996,1995,1994,1993,1992,1991,1990,1989,1988,1987,1986,1985,1984,1983,1982,1981,1980,1979,1978,1977,1976,1975,1974,1973,1972,1971,1970,1969,1968,1967,1966,1965,1964,1963,1962,1961
This statistics in other country:
AfghanistanAlbaniaAlgeriaAngolaAntigua and BarbudaArab WorldArgentinaArmeniaArubaAustraliaAustriaAzerbaijanBahamas, TheBahrainBangladeshBarbadosBelarusBelgiumBelizeBeninBhutanBoliviaBosnia and HerzegovinaBotswanaBrazilBrunei DarussalamBulgariaBurkina FasoBurundiCabo VerdeCambodiaCameroonCanadaCaribbean small statesCentral African RepublicCentral Europe and the BalticsChadChannel IslandsChileChinaColombiaComorosCongo, Dem. Rep.Congo, Rep.Costa RicaCote d'IvoireCroatiaCubaCuracaoCyprusCzech RepublicDenmarkDjiboutiDominicaDominican RepublicEarly-demographic dividendEast Asia & PacificEast Asia & Pacific (excluding high income)East Asia & Pacific (IDA & IBRD countries)EcuadorEgypt, Arab Rep.El SalvadorEquatorial GuineaEritreaEstoniaEthiopiaEuro areaEurope & Central AsiaEurope & Central Asia (excluding high income)Europe & Central Asia (IDA & IBRD countries)European UnionFijiFinlandFragile and conflict affected situationsFranceFrench PolynesiaGabonGambia, TheGeorgiaGermanyGhanaGreeceGreenlandGrenadaGuamGuatemalaGuineaGuinea-BissauGuyanaHaitiHeavily indebted poor countries (HIPC)High incomeHondurasHong Kong SAR, ChinaHungaryIBRD onlyIcelandIDA & IBRD totalIDA blendIDA onlyIDA totalIndiaIndonesiaIran, Islamic Rep.IraqIrelandIsraelItalyJamaicaJapanJordanKazakhstanKenyaKiribatiKorea, Dem. People’s Rep.Korea, Rep.KuwaitKyrgyz RepublicLao PDRLate-demographic dividendLatin America & Caribbean Latin America & Caribbean (excluding high income)Latin America & the Caribbean (IDA & IBRD countries)LatviaLeast developed countries: UN classificationLebanonLesothoLiberiaLibyaLithuaniaLow & middle incomeLow incomeLower middle incomeLuxembourgMacao SAR, ChinaMacedonia, FYRMadagascarMalawiMalaysiaMaldivesMaliMaltaMarshall IslandsMauritaniaMauritiusMexicoMicronesia, Fed. Sts.Middle East & North AfricaMiddle East & North Africa (excluding high income)Middle East & North Africa (IDA & IBRD countries)Middle incomeMoldovaMongoliaMontenegroMoroccoMozambiqueMyanmarNamibiaNepalNetherlandsNew CaledoniaNew ZealandNicaraguaNigerNigeriaNorth AmericaNorwayOECD membersOmanOther small statesPacific island small statesPakistanPanamaPapua New GuineaParaguayPeruPhilippinesPolandPortugalPost-demographic dividendPre-demographic dividendPuerto RicoQatarRomaniaRussian FederationRwandaSamoaSao Tome and PrincipeSaudi ArabiaSenegalSerbiaSeychellesSierra LeoneSingaporeSlovak RepublicSloveniaSmall statesSolomon IslandsSomaliaSouth AfricaSouth AsiaSouth Asia (IDA & IBRD)South SudanSpainSri LankaSt. Kitts and NevisSt. LuciaSt. Vincent and the GrenadinesSub-Saharan Africa Sub-Saharan Africa (excluding high income)Sub-Saharan Africa (IDA & IBRD countries)SudanSurinameSwazilandSwedenSwitzerlandSyrian Arab RepublicTajikistanTanzaniaThailandTimor-LesteTogoTongaTrinidad and TobagoTunisiaTurkeyTurkmenistanUgandaUkraineUnited Arab EmiratesUnited KingdomUnited StatesUpper middle incomeUruguayUzbekistanVanuatuVenezuela, RBVietnamVirgin Islands (U.S.)West Bank and GazaWorldYemen, Rep.ZambiaZimbabwe Timeline:
This timeline shows a graph from 1961 to 2013 of Belgium. No data until 1960. Number of actual observations by date: 53.
Source name:
World Development Indicators
Source organization:
(1) United Nations Population Division. World Population Prospects. New York, United Nations, Department of Economic and Social Affairs (advanced Excel tables). Available at http://esa.un.org/wpp/unpp/panel_population.htm, (2) University of California, Berkeley, and Max Planck Institute for Demographic Research. Human Mortality Database. [ www.mortality.org or www.humanmortality.de].
Categories, topics:
Health, Gender
Last updated:
apr 23, 2017
Indicators value changes by year
Minimum:
57.004
jan 1, 2013
Maximum:
109.744
jan 1, 1961
At the date of observation
Value
Absolute change
Change from previous value
jan 1, 1961
109.744
+109.744
0.0%
jan 1, 1962
104.904
-4.84
-4.41%
jan 1, 1963
109.022
+4.118
3.93%
jan 1, 1964
108.092
-0.93
-0.85%
jan 1, 1965
106.719
-1.373
-1.27%
jan 1, 1966
108.226
+1.507
1.41%
jan 1, 1967
107.443
-0.783
-0.72%
jan 1, 1968
104.835
-2.608
-2.43%
jan 1, 1969
106.235
+1.4
1.34%
jan 1, 1970
106.736
+0.501
0.47%
jan 1, 1971
105.342
-1.394
-1.31%
jan 1, 1972
102.812
-2.53
-2.4%
jan 1, 1973
102.257
-0.555
-0.54%
jan 1, 1974
100.638
-1.619
-1.58%
jan 1, 1975
99.246
-1.392
-1.38%
jan 1, 1976
100.222
+0.976
0.98%
jan 1, 1977
98.688
-1.534
-1.53%
jan 1, 1978
96.093
-2.595
-2.63%
jan 1, 1979
96.095
+0.002
0.0%
jan 1, 1980
93.705
-2.39
-2.49%
jan 1, 1981
90.859
-2.846
-3.04%
jan 1, 1982
88.339
-2.52
-2.77%
jan 1, 1983
88.479
+0.14
0.16%
jan 1, 1984
88.361
-0.118
-0.13%
jan 1, 1985
83.767
-4.594
-5.2%
jan 1, 1986
81.79
-1.977
-2.36%
jan 1, 1987
82.038
+0.248
0.3%
jan 1, 1988
78.651
-3.387
-4.13%
jan 1, 1989
76.649
-2.002
-2.55%
jan 1, 1990
76.562
-0.087
-0.11%
jan 1, 1991
75.066
-1.496
-1.95%
jan 1, 1992
72.279
-2.787
-3.71%
jan 1, 1993
73.369
+1.09
1.51%
jan 1, 1994
71.632
-1.737
-2.37%
jan 1, 1995
73.234
+1.602
2.24%
jan 1, 1996
71.335
-1.899
-2.59%
jan 1, 1997
70.636
-0.699
-0.98%
jan 1, 1998
70.726
+0.09
0.13%
jan 1, 1999
70.915
+0.189
0.27%
jan 1, 2000
67.424
-3.491
-4.92%
jan 1, 2001
68.603
+1.179
1.75%
jan 1, 2002
67.762
-0.841
-1.23%
jan 1, 2003
66.935
-0.827
-1.22%
jan 1, 2004
65.407
-1.528
-2.28%
jan 1, 2005
62.807
-2.6
-3.98%
jan 1, 2006
62.195
-0.612
-0.97%
jan 1, 2007
61.1
-1.095
-1.76%
jan 1, 2008
63.042
+1.942
3.18%
jan 1, 2009
61.637
-1.405
-2.23%
jan 1, 2010
61.088
-0.549
-0.89%
jan 1, 2011
59.248
-1.84
-3.01%
jan 1, 2012
59.442
+0.194
0.33%
jan 1, 2013
57.004
-2.438
-4.1%
Ranking of countries by current statistics by years


Comments: