29
/
en
AIzaSyAYiBZKx7MnpbEhh9jyipgxe19OcubqV5w
April 1, 2024
55735
Pre-demographic dividend
PRE
false
2
1
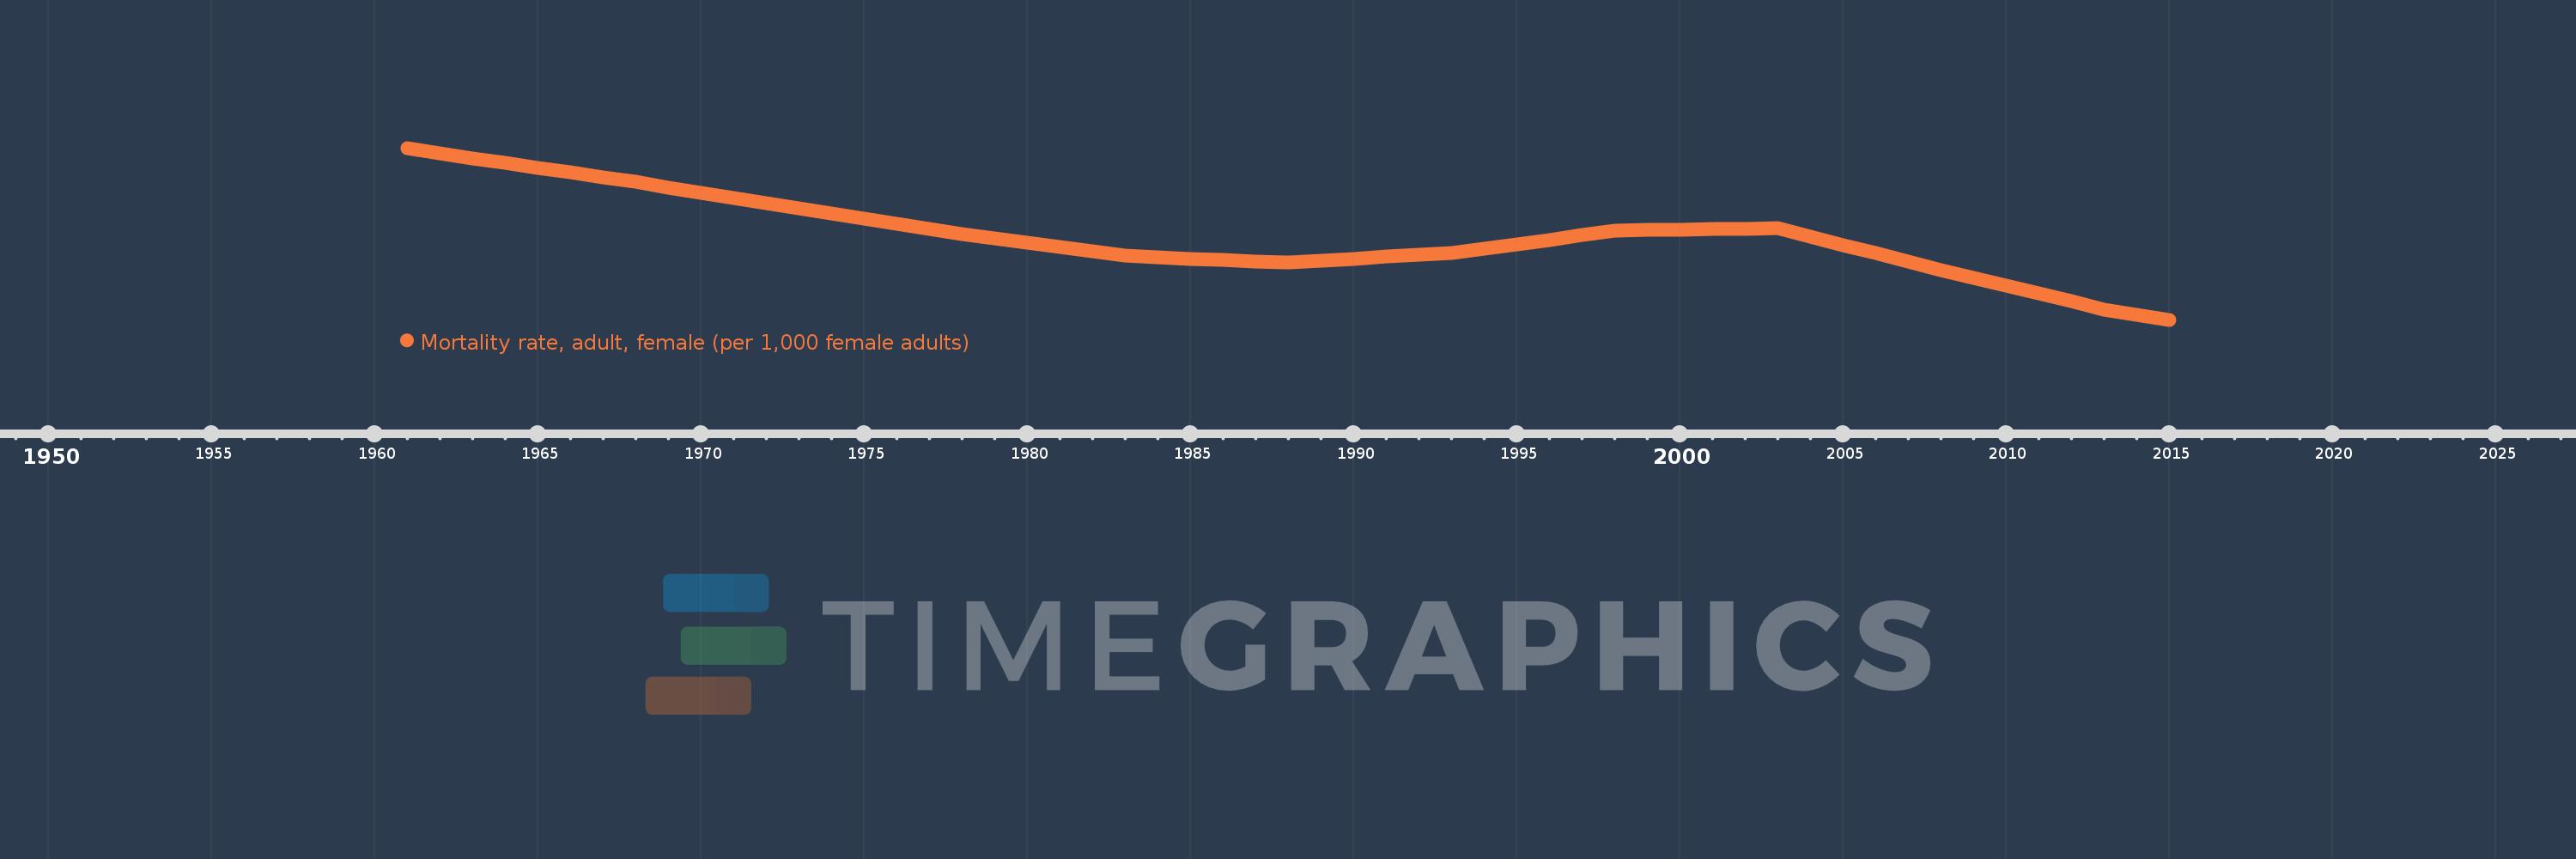
Mortality rate, adult, female (per 1,000 female adults)
2015,2014,2013,2012,2011,2010,2009,2008,2007,2006,2005,2004,2003,2002,2001,2000,1999,1998,1997,1996,1995,1994,1993,1992,1991,1990,1989,1988,1987,1986,1985,1984,1983,1982,1981,1980,1979,1978,1977,1976,1975,1974,1973,1972,1971,1970,1969,1968,1967,1966,1965,1964,1963,1962,1961
This statistics in other country:
AfghanistanAlbaniaAlgeriaAngolaAntigua and BarbudaArab WorldArgentinaArmeniaArubaAustraliaAustriaAzerbaijanBahamas, TheBahrainBangladeshBarbadosBelarusBelgiumBelizeBeninBhutanBoliviaBosnia and HerzegovinaBotswanaBrazilBrunei DarussalamBulgariaBurkina FasoBurundiCabo VerdeCambodiaCameroonCanadaCaribbean small statesCentral African RepublicCentral Europe and the BalticsChadChannel IslandsChileChinaColombiaComorosCongo, Dem. Rep.Congo, Rep.Costa RicaCote d'IvoireCroatiaCubaCuracaoCyprusCzech RepublicDenmarkDjiboutiDominicaDominican RepublicEarly-demographic dividendEast Asia & PacificEast Asia & Pacific (excluding high income)East Asia & Pacific (IDA & IBRD countries)EcuadorEgypt, Arab Rep.El SalvadorEquatorial GuineaEritreaEstoniaEthiopiaEuro areaEurope & Central AsiaEurope & Central Asia (excluding high income)Europe & Central Asia (IDA & IBRD countries)European UnionFijiFinlandFragile and conflict affected situationsFranceFrench PolynesiaGabonGambia, TheGeorgiaGermanyGhanaGreeceGreenlandGrenadaGuamGuatemalaGuineaGuinea-BissauGuyanaHaitiHeavily indebted poor countries (HIPC)High incomeHondurasHong Kong SAR, ChinaHungaryIBRD onlyIcelandIDA & IBRD totalIDA blendIDA onlyIDA totalIndiaIndonesiaIran, Islamic Rep.IraqIrelandIsraelItalyJamaicaJapanJordanKazakhstanKenyaKiribatiKorea, Dem. People’s Rep.Korea, Rep.KuwaitKyrgyz RepublicLao PDRLate-demographic dividendLatin America & Caribbean Latin America & Caribbean (excluding high income)Latin America & the Caribbean (IDA & IBRD countries)LatviaLeast developed countries: UN classificationLebanonLesothoLiberiaLibyaLithuaniaLow & middle incomeLow incomeLower middle incomeLuxembourgMacao SAR, ChinaMacedonia, FYRMadagascarMalawiMalaysiaMaldivesMaliMaltaMarshall IslandsMauritaniaMauritiusMexicoMicronesia, Fed. Sts.Middle East & North AfricaMiddle East & North Africa (excluding high income)Middle East & North Africa (IDA & IBRD countries)Middle incomeMoldovaMongoliaMontenegroMoroccoMozambiqueMyanmarNamibiaNepalNetherlandsNew CaledoniaNew ZealandNicaraguaNigerNigeriaNorth AmericaNorwayOECD membersOmanOther small statesPacific island small statesPakistanPanamaPapua New GuineaParaguayPeruPhilippinesPolandPortugalPost-demographic dividendPre-demographic dividendPuerto RicoQatarRomaniaRussian FederationRwandaSamoaSao Tome and PrincipeSaudi ArabiaSenegalSerbiaSeychellesSierra LeoneSingaporeSlovak RepublicSloveniaSmall statesSolomon IslandsSomaliaSouth AfricaSouth AsiaSouth Asia (IDA & IBRD)South SudanSpainSri LankaSt. Kitts and NevisSt. LuciaSt. Vincent and the GrenadinesSub-Saharan Africa Sub-Saharan Africa (excluding high income)Sub-Saharan Africa (IDA & IBRD countries)SudanSurinameSwazilandSwedenSwitzerlandSyrian Arab RepublicTajikistanTanzaniaThailandTimor-LesteTogoTongaTrinidad and TobagoTunisiaTurkeyTurkmenistanUgandaUkraineUnited Arab EmiratesUnited KingdomUnited StatesUpper middle incomeUruguayUzbekistanVanuatuVenezuela, RBVietnamVirgin Islands (U.S.)West Bank and GazaWorldYemen, Rep.ZambiaZimbabwe Timeline:
This timeline shows a graph from 1961 to 2015 of Pre-demographic dividend. No data until 1960. Number of actual observations by date: 55.
Source name:
World Development Indicators
Source organization:
(1) United Nations Population Division. World Population Prospects. New York, United Nations, Department of Economic and Social Affairs (advanced Excel tables). Available at http://esa.un.org/wpp/unpp/panel_population.htm, (2) University of California, Berkeley, and Max Planck Institute for Demographic Research. Human Mortality Database. [ www.mortality.org or www.humanmortality.de].
Categories, topics:
Health, Gender
Last updated:
apr 23, 2017
Indicators value changes by year
Minimum:
275.99
jan 1, 2015
Maximum:
439.716
jan 1, 1961
At the date of observation
Value
Absolute change
Change from previous value
jan 1, 1961
439.716
+439.716
0.0%
jan 1, 1962
434.831
-4.885
-1.11%
jan 1, 1963
429.987
-4.844
-1.11%
jan 1, 1964
425.484
-4.503
-1.05%
jan 1, 1965
420.978
-4.506
-1.06%
jan 1, 1966
416.451
-4.527
-1.08%
jan 1, 1967
411.87
-4.581
-1.1%
jan 1, 1968
407.267
-4.602
-1.12%
jan 1, 1969
402.133
-5.134
-1.26%
jan 1, 1970
397.021
-5.112
-1.27%
jan 1, 1971
391.943
-5.079
-1.28%
jan 1, 1972
386.844
-5.099
-1.3%
jan 1, 1973
381.765
-5.079
-1.31%
jan 1, 1974
376.917
-4.848
-1.27%
jan 1, 1975
372.081
-4.836
-1.28%
jan 1, 1976
367.249
-4.832
-1.3%
jan 1, 1977
362.369
-4.879
-1.33%
jan 1, 1978
357.509
-4.86
-1.34%
jan 1, 1979
353.474
-4.035
-1.13%
jan 1, 1980
349.429
-4.045
-1.14%
jan 1, 1981
345.361
-4.068
-1.16%
jan 1, 1982
341.197
-4.164
-1.21%
jan 1, 1983
337.007
-4.19
-1.23%
jan 1, 1984
335.532
-1.475
-0.44%
jan 1, 1985
334.117
-1.416
-0.42%
jan 1, 1986
332.783
-1.334
-0.4%
jan 1, 1987
331.516
-1.267
-0.38%
jan 1, 1988
330.348
-1.168
-0.35%
jan 1, 1989
332.221
+1.873
0.57%
jan 1, 1990
334.155
+1.935
0.58%
jan 1, 1991
336.098
+1.942
0.58%
jan 1, 1992
337.86
+1.763
0.52%
jan 1, 1993
339.533
+1.673
0.5%
jan 1, 1994
343.685
+4.152
1.22%
jan 1, 1995
347.891
+4.206
1.22%
jan 1, 1996
352.182
+4.291
1.23%
jan 1, 1997
356.544
+4.362
1.24%
jan 1, 1998
360.993
+4.449
1.25%
jan 1, 1999
361.439
+0.446
0.12%
jan 1, 2000
361.921
+0.482
0.13%
jan 1, 2001
362.405
+0.484
0.13%
jan 1, 2002
362.819
+0.414
0.11%
jan 1, 2003
363.194
+0.374
0.1%
jan 1, 2004
355.21
-7.984
-2.2%
jan 1, 2005
347.253
-7.957
-2.24%
jan 1, 2006
339.333
-7.92
-2.28%
jan 1, 2007
331.447
-7.886
-2.32%
jan 1, 2008
323.583
-7.864
-2.37%
jan 1, 2009
316.071
-7.512
-2.32%
jan 1, 2010
308.545
-7.526
-2.38%
jan 1, 2011
301.004
-7.542
-2.44%
jan 1, 2012
293.415
-7.589
-2.52%
jan 1, 2013
285.822
-7.593
-2.59%
jan 1, 2014
280.901
-4.921
-1.72%
jan 1, 2015
275.99
-4.911
-1.75%
Ranking of countries by current statistics by years


Comments: