29
/
en
AIzaSyAYiBZKx7MnpbEhh9jyipgxe19OcubqV5w
April 1, 2024
168814
Kiribati
KIR
true
2
1
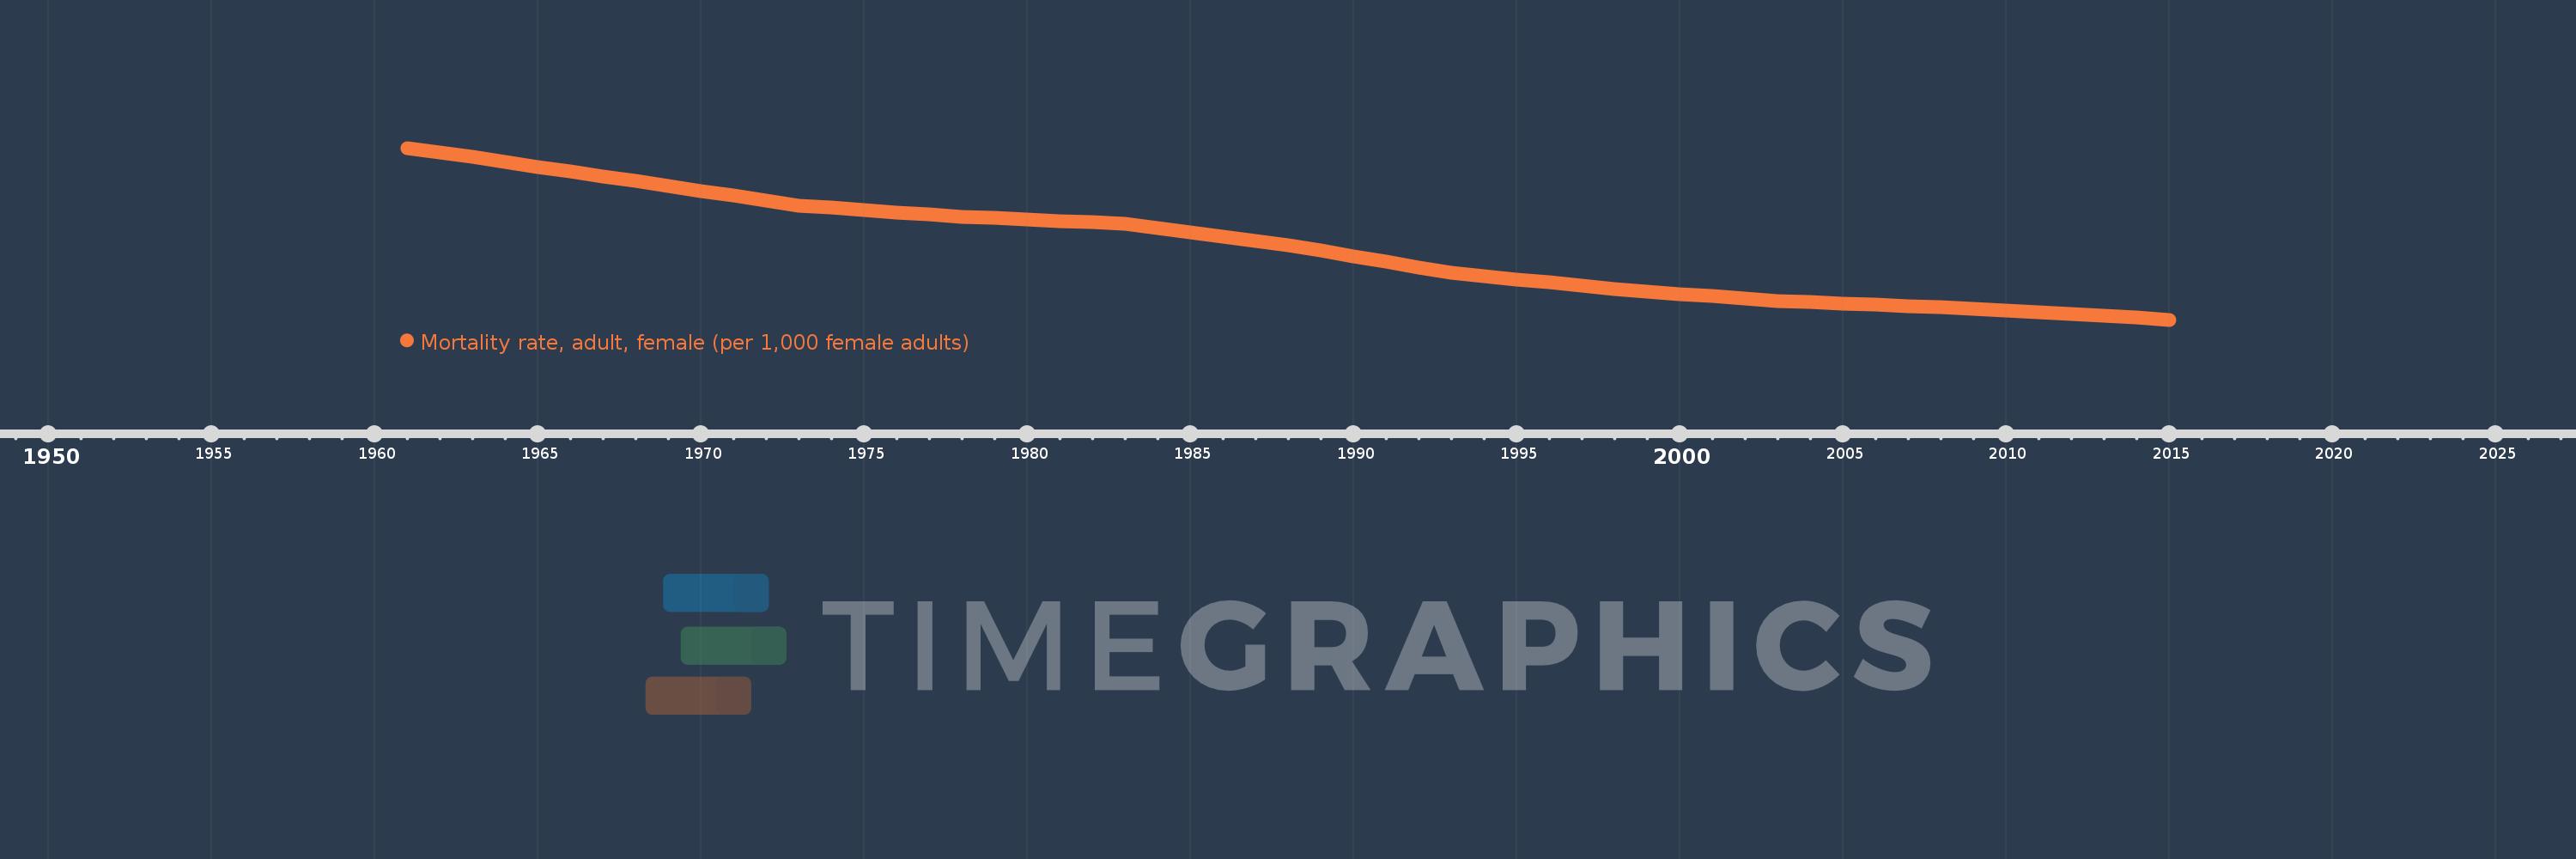
Mortality rate, adult, female (per 1,000 female adults)
2015,2014,2013,2012,2011,2010,2009,2008,2007,2006,2005,2004,2003,2002,2001,2000,1999,1998,1997,1996,1995,1994,1993,1992,1991,1990,1989,1988,1987,1986,1985,1984,1983,1982,1981,1980,1979,1978,1977,1976,1975,1974,1973,1972,1971,1970,1969,1968,1967,1966,1965,1964,1963,1962,1961
This statistics in other country:
AfghanistanAlbaniaAlgeriaAngolaAntigua and BarbudaArab WorldArgentinaArmeniaArubaAustraliaAustriaAzerbaijanBahamas, TheBahrainBangladeshBarbadosBelarusBelgiumBelizeBeninBhutanBoliviaBosnia and HerzegovinaBotswanaBrazilBrunei DarussalamBulgariaBurkina FasoBurundiCabo VerdeCambodiaCameroonCanadaCaribbean small statesCentral African RepublicCentral Europe and the BalticsChadChannel IslandsChileChinaColombiaComorosCongo, Dem. Rep.Congo, Rep.Costa RicaCote d'IvoireCroatiaCubaCuracaoCyprusCzech RepublicDenmarkDjiboutiDominicaDominican RepublicEarly-demographic dividendEast Asia & PacificEast Asia & Pacific (excluding high income)East Asia & Pacific (IDA & IBRD countries)EcuadorEgypt, Arab Rep.El SalvadorEquatorial GuineaEritreaEstoniaEthiopiaEuro areaEurope & Central AsiaEurope & Central Asia (excluding high income)Europe & Central Asia (IDA & IBRD countries)European UnionFijiFinlandFragile and conflict affected situationsFranceFrench PolynesiaGabonGambia, TheGeorgiaGermanyGhanaGreeceGreenlandGrenadaGuamGuatemalaGuineaGuinea-BissauGuyanaHaitiHeavily indebted poor countries (HIPC)High incomeHondurasHong Kong SAR, ChinaHungaryIBRD onlyIcelandIDA & IBRD totalIDA blendIDA onlyIDA totalIndiaIndonesiaIran, Islamic Rep.IraqIrelandIsraelItalyJamaicaJapanJordanKazakhstanKenyaKiribatiKorea, Dem. People’s Rep.Korea, Rep.KuwaitKyrgyz RepublicLao PDRLate-demographic dividendLatin America & Caribbean Latin America & Caribbean (excluding high income)Latin America & the Caribbean (IDA & IBRD countries)LatviaLeast developed countries: UN classificationLebanonLesothoLiberiaLibyaLithuaniaLow & middle incomeLow incomeLower middle incomeLuxembourgMacao SAR, ChinaMacedonia, FYRMadagascarMalawiMalaysiaMaldivesMaliMaltaMarshall IslandsMauritaniaMauritiusMexicoMicronesia, Fed. Sts.Middle East & North AfricaMiddle East & North Africa (excluding high income)Middle East & North Africa (IDA & IBRD countries)Middle incomeMoldovaMongoliaMontenegroMoroccoMozambiqueMyanmarNamibiaNepalNetherlandsNew CaledoniaNew ZealandNicaraguaNigerNigeriaNorth AmericaNorwayOECD membersOmanOther small statesPacific island small statesPakistanPanamaPapua New GuineaParaguayPeruPhilippinesPolandPortugalPost-demographic dividendPre-demographic dividendPuerto RicoQatarRomaniaRussian FederationRwandaSamoaSao Tome and PrincipeSaudi ArabiaSenegalSerbiaSeychellesSierra LeoneSingaporeSlovak RepublicSloveniaSmall statesSolomon IslandsSomaliaSouth AfricaSouth AsiaSouth Asia (IDA & IBRD)South SudanSpainSri LankaSt. Kitts and NevisSt. LuciaSt. Vincent and the GrenadinesSub-Saharan Africa Sub-Saharan Africa (excluding high income)Sub-Saharan Africa (IDA & IBRD countries)SudanSurinameSwazilandSwedenSwitzerlandSyrian Arab RepublicTajikistanTanzaniaThailandTimor-LesteTogoTongaTrinidad and TobagoTunisiaTurkeyTurkmenistanUgandaUkraineUnited Arab EmiratesUnited KingdomUnited StatesUpper middle incomeUruguayUzbekistanVanuatuVenezuela, RBVietnamVirgin Islands (U.S.)West Bank and GazaWorldYemen, Rep.ZambiaZimbabwe Timeline:
This timeline shows a graph from 1961 to 2015 of Kiribati. No data until 1960. Number of actual observations by date: 55.
Source name:
World Development Indicators
Source organization:
(1) United Nations Population Division. World Population Prospects. New York, United Nations, Department of Economic and Social Affairs (advanced Excel tables). Available at http://esa.un.org/wpp/unpp/panel_population.htm, (2) University of California, Berkeley, and Max Planck Institute for Demographic Research. Human Mortality Database. [ www.mortality.org or www.humanmortality.de].
Categories, topics:
Health, Gender
Last updated:
apr 23, 2017
Indicators value changes by year
Minimum:
158.843
jan 1, 2015
Maximum:
341.545
jan 1, 1961
At the date of observation
Value
Absolute change
Change from previous value
jan 1, 1961
341.545
+341.545
0.0%
jan 1, 1962
336.631
-4.914
-1.44%
jan 1, 1963
331.717
-4.914
-1.46%
jan 1, 1964
326.629
-5.088
-1.53%
jan 1, 1965
321.54
-5.089
-1.56%
jan 1, 1966
316.451
-5.089
-1.58%
jan 1, 1967
311.362
-5.089
-1.61%
jan 1, 1968
306.274
-5.088
-1.63%
jan 1, 1969
301.075
-5.199
-1.7%
jan 1, 1970
295.876
-5.199
-1.73%
jan 1, 1971
290.677
-5.199
-1.76%
jan 1, 1972
285.479
-5.198
-1.79%
jan 1, 1973
280.28
-5.199
-1.82%
jan 1, 1974
277.922
-2.358
-0.84%
jan 1, 1975
275.564
-2.358
-0.85%
jan 1, 1976
273.206
-2.358
-0.86%
jan 1, 1977
270.848
-2.358
-0.86%
jan 1, 1978
268.49
-2.358
-0.87%
jan 1, 1979
266.951
-1.539
-0.57%
jan 1, 1980
265.412
-1.539
-0.58%
jan 1, 1981
263.873
-1.539
-0.58%
jan 1, 1982
262.334
-1.539
-0.58%
jan 1, 1983
260.794
-1.54
-0.59%
jan 1, 1984
256.288
-4.506
-1.73%
jan 1, 1985
251.782
-4.506
-1.76%
jan 1, 1986
247.276
-4.506
-1.79%
jan 1, 1987
242.77
-4.506
-1.82%
jan 1, 1988
238.263
-4.507
-1.86%
jan 1, 1989
232.332
-5.931
-2.49%
jan 1, 1990
226.401
-5.931
-2.55%
jan 1, 1991
220.47
-5.931
-2.62%
jan 1, 1992
214.539
-5.931
-2.69%
jan 1, 1993
208.608
-5.931
-2.76%
jan 1, 1994
205.186
-3.422
-1.64%
jan 1, 1995
201.763
-3.423
-1.67%
jan 1, 1996
198.34
-3.423
-1.7%
jan 1, 1997
194.917
-3.423
-1.73%
jan 1, 1998
191.494
-3.423
-1.76%
jan 1, 1999
188.931
-2.563
-1.34%
jan 1, 2000
186.368
-2.563
-1.36%
jan 1, 2001
183.805
-2.563
-1.38%
jan 1, 2002
181.242
-2.563
-1.39%
jan 1, 2003
178.679
-2.563
-1.41%
jan 1, 2004
177.324
-1.355
-0.76%
jan 1, 2005
175.969
-1.355
-0.76%
jan 1, 2006
174.614
-1.355
-0.77%
jan 1, 2007
173.259
-1.355
-0.78%
jan 1, 2008
171.903
-1.356
-0.78%
jan 1, 2009
170.215
-1.688
-0.98%
jan 1, 2010
168.526
-1.689
-0.99%
jan 1, 2011
166.837
-1.689
-1.0%
jan 1, 2012
165.149
-1.688
-1.01%
jan 1, 2013
163.46
-1.689
-1.02%
jan 1, 2014
161.151
-2.309
-1.41%
jan 1, 2015
158.843
-2.308
-1.43%
Ranking of countries by current statistics by years


Comments: