29
/
en
AIzaSyAYiBZKx7MnpbEhh9jyipgxe19OcubqV5w
April 1, 2024
277977
Uruguay
URY
true
2
1
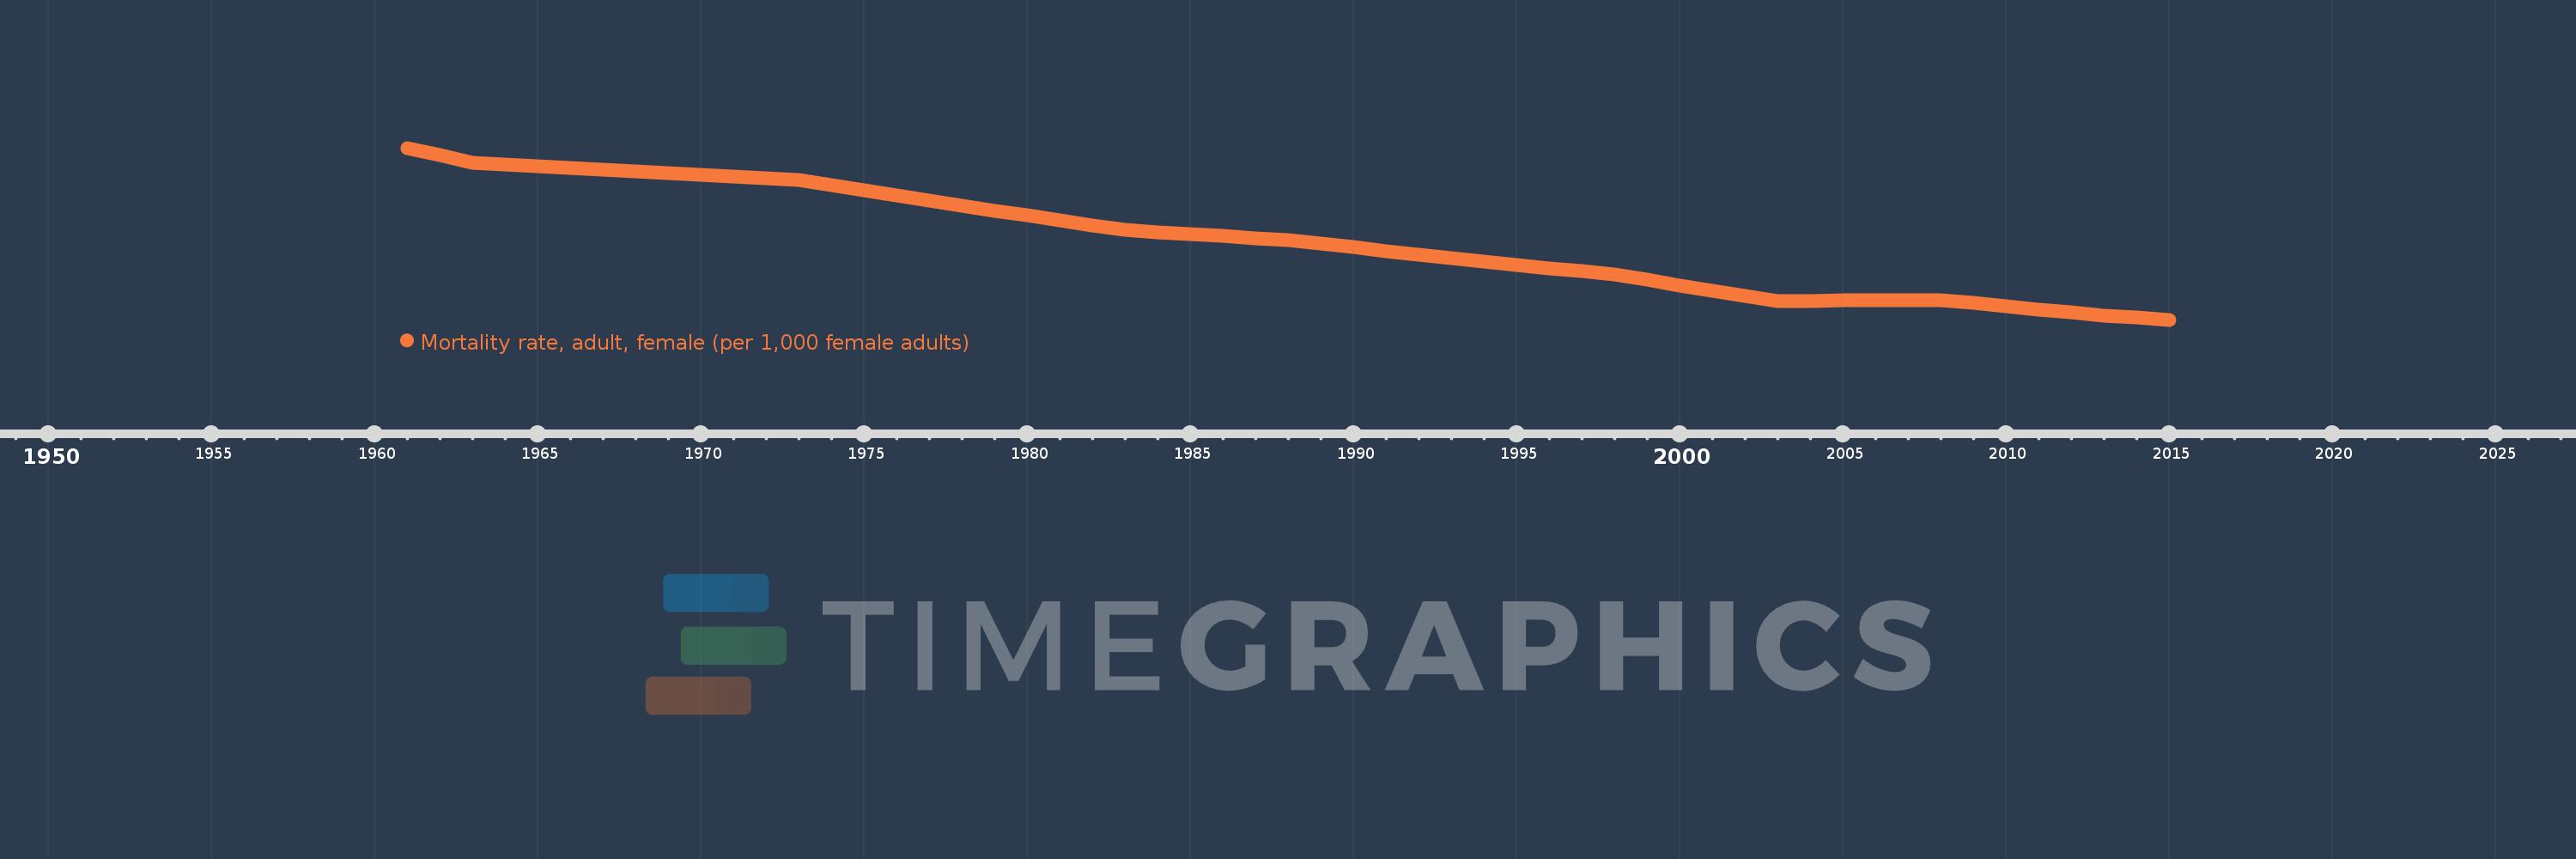
Mortality rate, adult, female (per 1,000 female adults)
2015,2014,2013,2012,2011,2010,2009,2008,2007,2006,2005,2004,2003,2002,2001,2000,1999,1998,1997,1996,1995,1994,1993,1992,1991,1990,1989,1988,1987,1986,1985,1984,1983,1982,1981,1980,1979,1978,1977,1976,1975,1974,1973,1972,1971,1970,1969,1968,1967,1966,1965,1964,1963,1962,1961
This statistics in other country:
AfghanistanAlbaniaAlgeriaAngolaAntigua and BarbudaArab WorldArgentinaArmeniaArubaAustraliaAustriaAzerbaijanBahamas, TheBahrainBangladeshBarbadosBelarusBelgiumBelizeBeninBhutanBoliviaBosnia and HerzegovinaBotswanaBrazilBrunei DarussalamBulgariaBurkina FasoBurundiCabo VerdeCambodiaCameroonCanadaCaribbean small statesCentral African RepublicCentral Europe and the BalticsChadChannel IslandsChileChinaColombiaComorosCongo, Dem. Rep.Congo, Rep.Costa RicaCote d'IvoireCroatiaCubaCuracaoCyprusCzech RepublicDenmarkDjiboutiDominicaDominican RepublicEarly-demographic dividendEast Asia & PacificEast Asia & Pacific (excluding high income)East Asia & Pacific (IDA & IBRD countries)EcuadorEgypt, Arab Rep.El SalvadorEquatorial GuineaEritreaEstoniaEthiopiaEuro areaEurope & Central AsiaEurope & Central Asia (excluding high income)Europe & Central Asia (IDA & IBRD countries)European UnionFijiFinlandFragile and conflict affected situationsFranceFrench PolynesiaGabonGambia, TheGeorgiaGermanyGhanaGreeceGreenlandGrenadaGuamGuatemalaGuineaGuinea-BissauGuyanaHaitiHeavily indebted poor countries (HIPC)High incomeHondurasHong Kong SAR, ChinaHungaryIBRD onlyIcelandIDA & IBRD totalIDA blendIDA onlyIDA totalIndiaIndonesiaIran, Islamic Rep.IraqIrelandIsraelItalyJamaicaJapanJordanKazakhstanKenyaKiribatiKorea, Dem. People’s Rep.Korea, Rep.KuwaitKyrgyz RepublicLao PDRLate-demographic dividendLatin America & Caribbean Latin America & Caribbean (excluding high income)Latin America & the Caribbean (IDA & IBRD countries)LatviaLeast developed countries: UN classificationLebanonLesothoLiberiaLibyaLithuaniaLow & middle incomeLow incomeLower middle incomeLuxembourgMacao SAR, ChinaMacedonia, FYRMadagascarMalawiMalaysiaMaldivesMaliMaltaMarshall IslandsMauritaniaMauritiusMexicoMicronesia, Fed. Sts.Middle East & North AfricaMiddle East & North Africa (excluding high income)Middle East & North Africa (IDA & IBRD countries)Middle incomeMoldovaMongoliaMontenegroMoroccoMozambiqueMyanmarNamibiaNepalNetherlandsNew CaledoniaNew ZealandNicaraguaNigerNigeriaNorth AmericaNorwayOECD membersOmanOther small statesPacific island small statesPakistanPanamaPapua New GuineaParaguayPeruPhilippinesPolandPortugalPost-demographic dividendPre-demographic dividendPuerto RicoQatarRomaniaRussian FederationRwandaSamoaSao Tome and PrincipeSaudi ArabiaSenegalSerbiaSeychellesSierra LeoneSingaporeSlovak RepublicSloveniaSmall statesSolomon IslandsSomaliaSouth AfricaSouth AsiaSouth Asia (IDA & IBRD)South SudanSpainSri LankaSt. Kitts and NevisSt. LuciaSt. Vincent and the GrenadinesSub-Saharan Africa Sub-Saharan Africa (excluding high income)Sub-Saharan Africa (IDA & IBRD countries)SudanSurinameSwazilandSwedenSwitzerlandSyrian Arab RepublicTajikistanTanzaniaThailandTimor-LesteTogoTongaTrinidad and TobagoTunisiaTurkeyTurkmenistanUgandaUkraineUnited Arab EmiratesUnited KingdomUnited StatesUpper middle incomeUruguayUzbekistanVanuatuVenezuela, RBVietnamVirgin Islands (U.S.)West Bank and GazaWorldYemen, Rep.ZambiaZimbabwe Timeline:
This timeline shows a graph from 1961 to 2015 of Uruguay. No data until 1960. Number of actual observations by date: 55.
Source name:
World Development Indicators
Source organization:
(1) United Nations Population Division. World Population Prospects. New York, United Nations, Department of Economic and Social Affairs (advanced Excel tables). Available at http://esa.un.org/wpp/unpp/panel_population.htm, (2) University of California, Berkeley, and Max Planck Institute for Demographic Research. Human Mortality Database. [ www.mortality.org or www.humanmortality.de].
Categories, topics:
Health, Gender
Last updated:
apr 23, 2017
Indicators value changes by year
Minimum:
77.073
jan 1, 2015
Maximum:
133.32
jan 1, 1961
At the date of observation
Value
Absolute change
Change from previous value
jan 1, 1961
133.32
+133.32
0.0%
jan 1, 1962
130.887
-2.433
-1.82%
jan 1, 1963
128.455
-2.432
-1.86%
jan 1, 1964
127.897
-0.558
-0.43%
jan 1, 1965
127.339
-0.558
-0.44%
jan 1, 1966
126.78
-0.559
-0.44%
jan 1, 1967
126.222
-0.558
-0.44%
jan 1, 1968
125.664
-0.558
-0.44%
jan 1, 1969
125.119
-0.545
-0.43%
jan 1, 1970
124.574
-0.545
-0.44%
jan 1, 1971
124.029
-0.545
-0.44%
jan 1, 1972
123.483
-0.546
-0.44%
jan 1, 1973
122.938
-0.545
-0.44%
jan 1, 1974
121.209
-1.729
-1.41%
jan 1, 1975
119.48
-1.729
-1.43%
jan 1, 1976
117.751
-1.729
-1.45%
jan 1, 1977
116.022
-1.729
-1.47%
jan 1, 1978
114.293
-1.729
-1.49%
jan 1, 1979
112.727
-1.566
-1.37%
jan 1, 1980
111.161
-1.566
-1.39%
jan 1, 1981
109.595
-1.566
-1.41%
jan 1, 1982
108.029
-1.566
-1.43%
jan 1, 1983
106.462
-1.567
-1.45%
jan 1, 1984
105.788
-0.674
-0.63%
jan 1, 1985
105.113
-0.675
-0.64%
jan 1, 1986
104.438
-0.675
-0.64%
jan 1, 1987
103.764
-0.674
-0.65%
jan 1, 1988
103.089
-0.675
-0.65%
jan 1, 1989
101.933
-1.156
-1.12%
jan 1, 1990
100.778
-1.155
-1.13%
jan 1, 1991
99.623
-1.155
-1.15%
jan 1, 1992
98.467
-1.156
-1.16%
jan 1, 1993
97.312
-1.155
-1.17%
jan 1, 1994
96.209
-1.103
-1.13%
jan 1, 1995
95.105
-1.104
-1.15%
jan 1, 1996
94.002
-1.103
-1.16%
jan 1, 1997
92.899
-1.103
-1.17%
jan 1, 1998
91.795
-1.104
-1.19%
jan 1, 1999
90.076
-1.719
-1.87%
jan 1, 2000
88.356
-1.72
-1.91%
jan 1, 2001
86.637
-1.719
-1.95%
jan 1, 2002
84.917
-1.72
-1.99%
jan 1, 2003
83.198
-1.719
-2.02%
jan 1, 2004
83.27
+0.072
0.09%
jan 1, 2005
83.343
+0.073
0.09%
jan 1, 2006
83.416
+0.073
0.09%
jan 1, 2007
83.488
+0.072
0.09%
jan 1, 2008
83.561
+0.073
0.09%
jan 1, 2009
82.523
-1.038
-1.24%
jan 1, 2010
81.484
-1.039
-1.26%
jan 1, 2011
80.445
-1.039
-1.28%
jan 1, 2012
79.407
-1.038
-1.29%
jan 1, 2013
78.368
-1.039
-1.31%
jan 1, 2014
77.72
-0.648
-0.83%
jan 1, 2015
77.073
-0.647
-0.83%
Ranking of countries by current statistics by years


Comments: