29
/
en
AIzaSyAYiBZKx7MnpbEhh9jyipgxe19OcubqV5w
April 1, 2024
208218
Netherlands
NLD
true
2
1
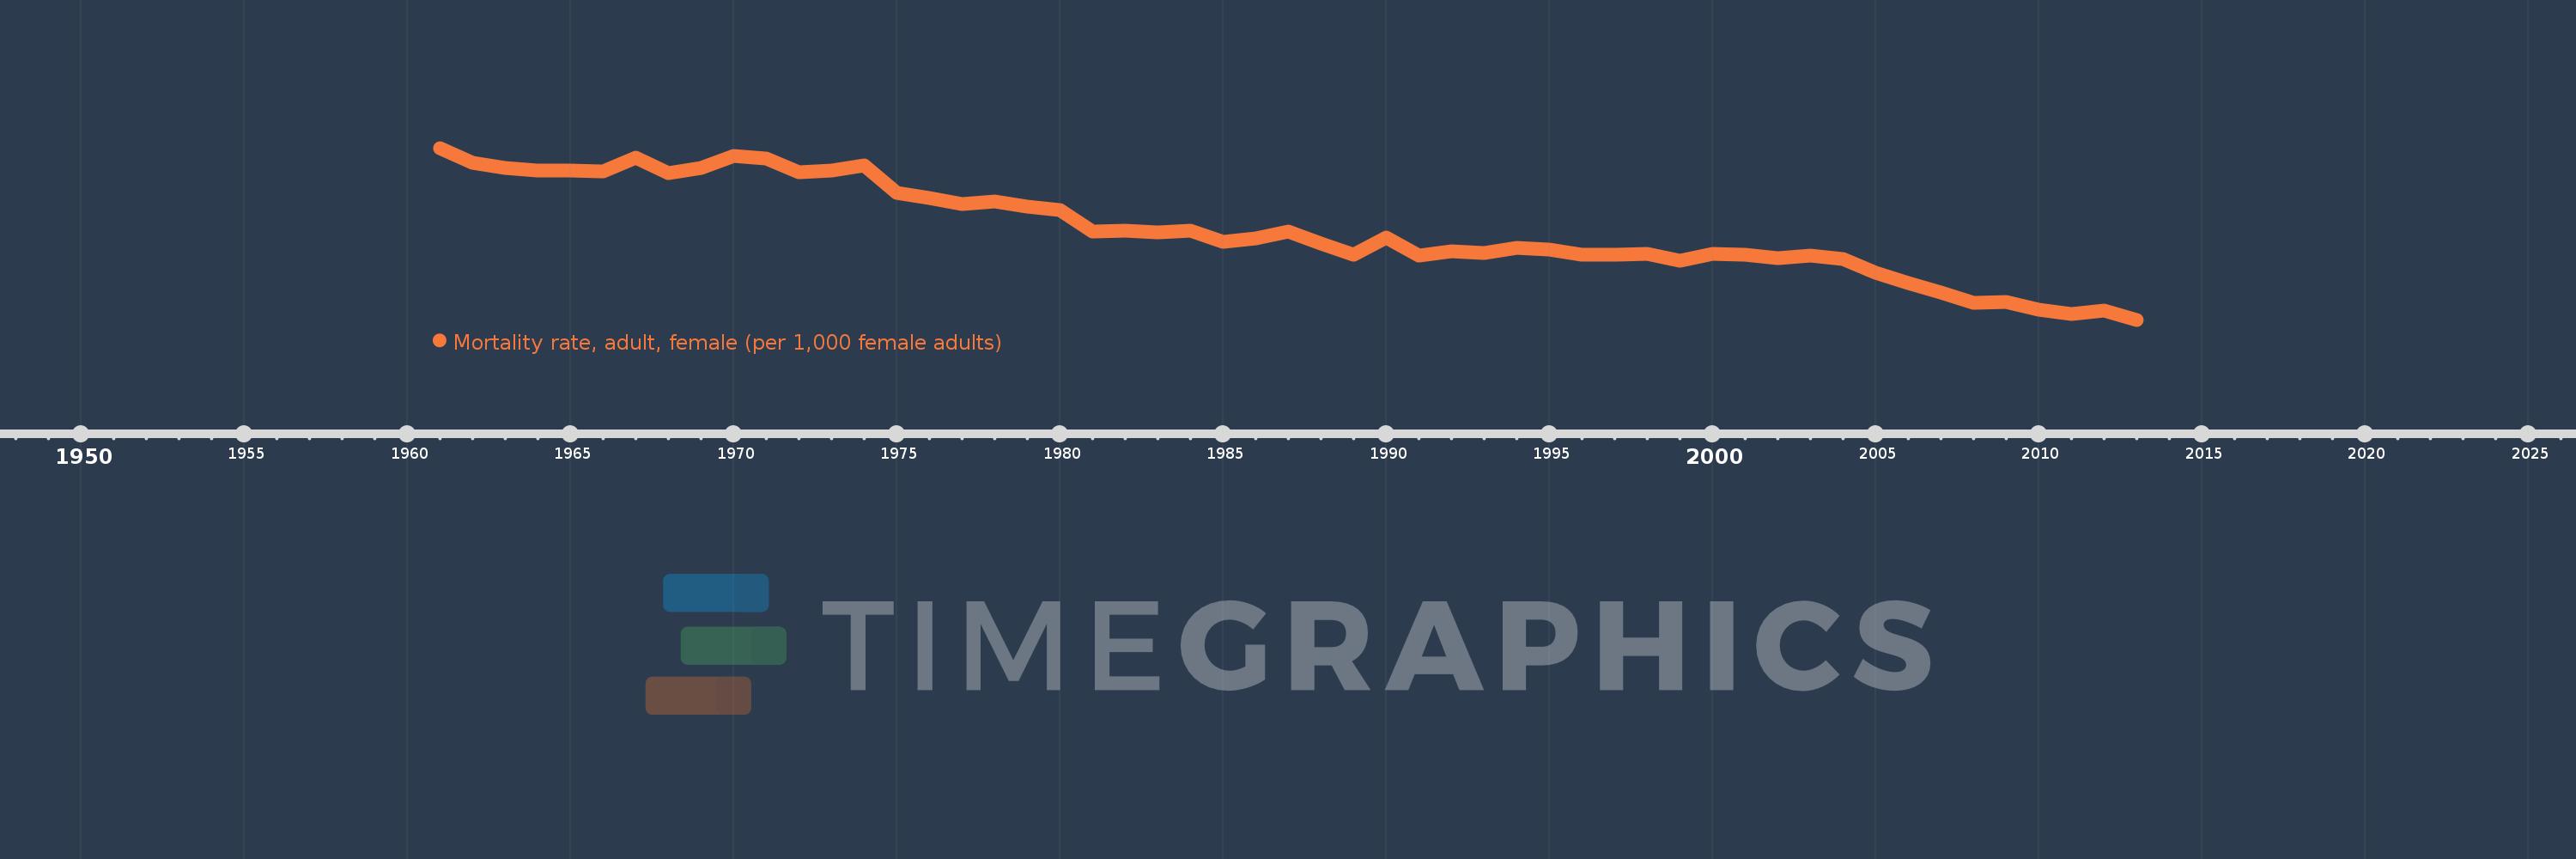
Mortality rate, adult, female (per 1,000 female adults)
2013,2012,2011,2010,2009,2008,2007,2006,2005,2004,2003,2002,2001,2000,1999,1998,1997,1996,1995,1994,1993,1992,1991,1990,1989,1988,1987,1986,1985,1984,1983,1982,1981,1980,1979,1978,1977,1976,1975,1974,1973,1972,1971,1970,1969,1968,1967,1966,1965,1964,1963,1962,1961
This statistics in other country:
AfghanistanAlbaniaAlgeriaAngolaAntigua and BarbudaArab WorldArgentinaArmeniaArubaAustraliaAustriaAzerbaijanBahamas, TheBahrainBangladeshBarbadosBelarusBelgiumBelizeBeninBhutanBoliviaBosnia and HerzegovinaBotswanaBrazilBrunei DarussalamBulgariaBurkina FasoBurundiCabo VerdeCambodiaCameroonCanadaCaribbean small statesCentral African RepublicCentral Europe and the BalticsChadChannel IslandsChileChinaColombiaComorosCongo, Dem. Rep.Congo, Rep.Costa RicaCote d'IvoireCroatiaCubaCuracaoCyprusCzech RepublicDenmarkDjiboutiDominicaDominican RepublicEarly-demographic dividendEast Asia & PacificEast Asia & Pacific (excluding high income)East Asia & Pacific (IDA & IBRD countries)EcuadorEgypt, Arab Rep.El SalvadorEquatorial GuineaEritreaEstoniaEthiopiaEuro areaEurope & Central AsiaEurope & Central Asia (excluding high income)Europe & Central Asia (IDA & IBRD countries)European UnionFijiFinlandFragile and conflict affected situationsFranceFrench PolynesiaGabonGambia, TheGeorgiaGermanyGhanaGreeceGreenlandGrenadaGuamGuatemalaGuineaGuinea-BissauGuyanaHaitiHeavily indebted poor countries (HIPC)High incomeHondurasHong Kong SAR, ChinaHungaryIBRD onlyIcelandIDA & IBRD totalIDA blendIDA onlyIDA totalIndiaIndonesiaIran, Islamic Rep.IraqIrelandIsraelItalyJamaicaJapanJordanKazakhstanKenyaKiribatiKorea, Dem. People’s Rep.Korea, Rep.KuwaitKyrgyz RepublicLao PDRLate-demographic dividendLatin America & Caribbean Latin America & Caribbean (excluding high income)Latin America & the Caribbean (IDA & IBRD countries)LatviaLeast developed countries: UN classificationLebanonLesothoLiberiaLibyaLithuaniaLow & middle incomeLow incomeLower middle incomeLuxembourgMacao SAR, ChinaMacedonia, FYRMadagascarMalawiMalaysiaMaldivesMaliMaltaMarshall IslandsMauritaniaMauritiusMexicoMicronesia, Fed. Sts.Middle East & North AfricaMiddle East & North Africa (excluding high income)Middle East & North Africa (IDA & IBRD countries)Middle incomeMoldovaMongoliaMontenegroMoroccoMozambiqueMyanmarNamibiaNepalNetherlandsNew CaledoniaNew ZealandNicaraguaNigerNigeriaNorth AmericaNorwayOECD membersOmanOther small statesPacific island small statesPakistanPanamaPapua New GuineaParaguayPeruPhilippinesPolandPortugalPost-demographic dividendPre-demographic dividendPuerto RicoQatarRomaniaRussian FederationRwandaSamoaSao Tome and PrincipeSaudi ArabiaSenegalSerbiaSeychellesSierra LeoneSingaporeSlovak RepublicSloveniaSmall statesSolomon IslandsSomaliaSouth AfricaSouth AsiaSouth Asia (IDA & IBRD)South SudanSpainSri LankaSt. Kitts and NevisSt. LuciaSt. Vincent and the GrenadinesSub-Saharan Africa Sub-Saharan Africa (excluding high income)Sub-Saharan Africa (IDA & IBRD countries)SudanSurinameSwazilandSwedenSwitzerlandSyrian Arab RepublicTajikistanTanzaniaThailandTimor-LesteTogoTongaTrinidad and TobagoTunisiaTurkeyTurkmenistanUgandaUkraineUnited Arab EmiratesUnited KingdomUnited StatesUpper middle incomeUruguayUzbekistanVanuatuVenezuela, RBVietnamVirgin Islands (U.S.)West Bank and GazaWorldYemen, Rep.ZambiaZimbabwe Timeline:
This timeline shows a graph from 1961 to 2013 of Netherlands. No data until 1960. Number of actual observations by date: 53.
Source name:
World Development Indicators
Source organization:
(1) United Nations Population Division. World Population Prospects. New York, United Nations, Department of Economic and Social Affairs (advanced Excel tables). Available at http://esa.un.org/wpp/unpp/panel_population.htm, (2) University of California, Berkeley, and Max Planck Institute for Demographic Research. Human Mortality Database. [ www.mortality.org or www.humanmortality.de].
Categories, topics:
Health, Gender
Last updated:
apr 23, 2017
Indicators value changes by year
Minimum:
53.789
jan 1, 2013
Maximum:
89.325
jan 1, 1961
At the date of observation
Value
Absolute change
Change from previous value
jan 1, 1961
89.325
+89.325
0.0%
jan 1, 1962
86.204
-3.121
-3.49%
jan 1, 1963
85.258
-0.946
-1.1%
jan 1, 1964
84.582
-0.676
-0.79%
jan 1, 1965
84.613
+0.031
0.04%
jan 1, 1966
84.542
-0.071
-0.08%
jan 1, 1967
87.232
+2.69
3.18%
jan 1, 1968
84.093
-3.139
-3.6%
jan 1, 1969
85.197
+1.104
1.31%
jan 1, 1970
87.724
+2.527
2.97%
jan 1, 1971
87.128
-0.596
-0.68%
jan 1, 1972
84.364
-2.764
-3.17%
jan 1, 1973
84.692
+0.328
0.39%
jan 1, 1974
85.731
+1.039
1.23%
jan 1, 1975
79.995
-5.736
-6.69%
jan 1, 1976
78.977
-1.018
-1.27%
jan 1, 1977
77.681
-1.296
-1.64%
jan 1, 1978
78.254
+0.573
0.74%
jan 1, 1979
77.272
-0.982
-1.25%
jan 1, 1980
76.54
-0.732
-0.95%
jan 1, 1981
72.116
-4.424
-5.78%
jan 1, 1982
72.261
+0.145
0.2%
jan 1, 1983
71.932
-0.329
-0.46%
jan 1, 1984
72.22
+0.288
0.4%
jan 1, 1985
69.87
-2.35
-3.25%
jan 1, 1986
70.559
+0.689
0.99%
jan 1, 1987
72.082
+1.523
2.16%
jan 1, 1988
69.573
-2.509
-3.48%
jan 1, 1989
67.19
-2.383
-3.43%
jan 1, 1990
70.711
+3.521
5.24%
jan 1, 1991
67.138
-3.573
-5.05%
jan 1, 1992
68.032
+0.894
1.33%
jan 1, 1993
67.563
-0.469
-0.69%
jan 1, 1994
68.725
+1.162
1.72%
jan 1, 1995
68.23
-0.495
-0.72%
jan 1, 1996
67.153
-1.077
-1.58%
jan 1, 1997
67.263
+0.11
0.16%
jan 1, 1998
67.422
+0.159
0.24%
jan 1, 1999
65.935
-1.487
-2.21%
jan 1, 2000
67.382
+1.447
2.19%
jan 1, 2001
67.212
-0.17
-0.25%
jan 1, 2002
66.526
-0.686
-1.02%
jan 1, 2003
67.028
+0.502
0.75%
jan 1, 2004
66.295
-0.733
-1.09%
jan 1, 2005
63.558
-2.737
-4.13%
jan 1, 2006
61.292
-2.266
-3.57%
jan 1, 2007
59.335
-1.957
-3.19%
jan 1, 2008
57.37
-1.965
-3.31%
jan 1, 2009
57.517
+0.147
0.26%
jan 1, 2010
55.921
-1.596
-2.77%
jan 1, 2011
54.901
-1.02
-1.82%
jan 1, 2012
55.697
+0.796
1.45%
jan 1, 2013
53.789
-1.908
-3.43%
Ranking of countries by current statistics by years


Comments: