29
/
en
AIzaSyAYiBZKx7MnpbEhh9jyipgxe19OcubqV5w
April 1, 2024
177927
Lesotho
LSO
true
2
1
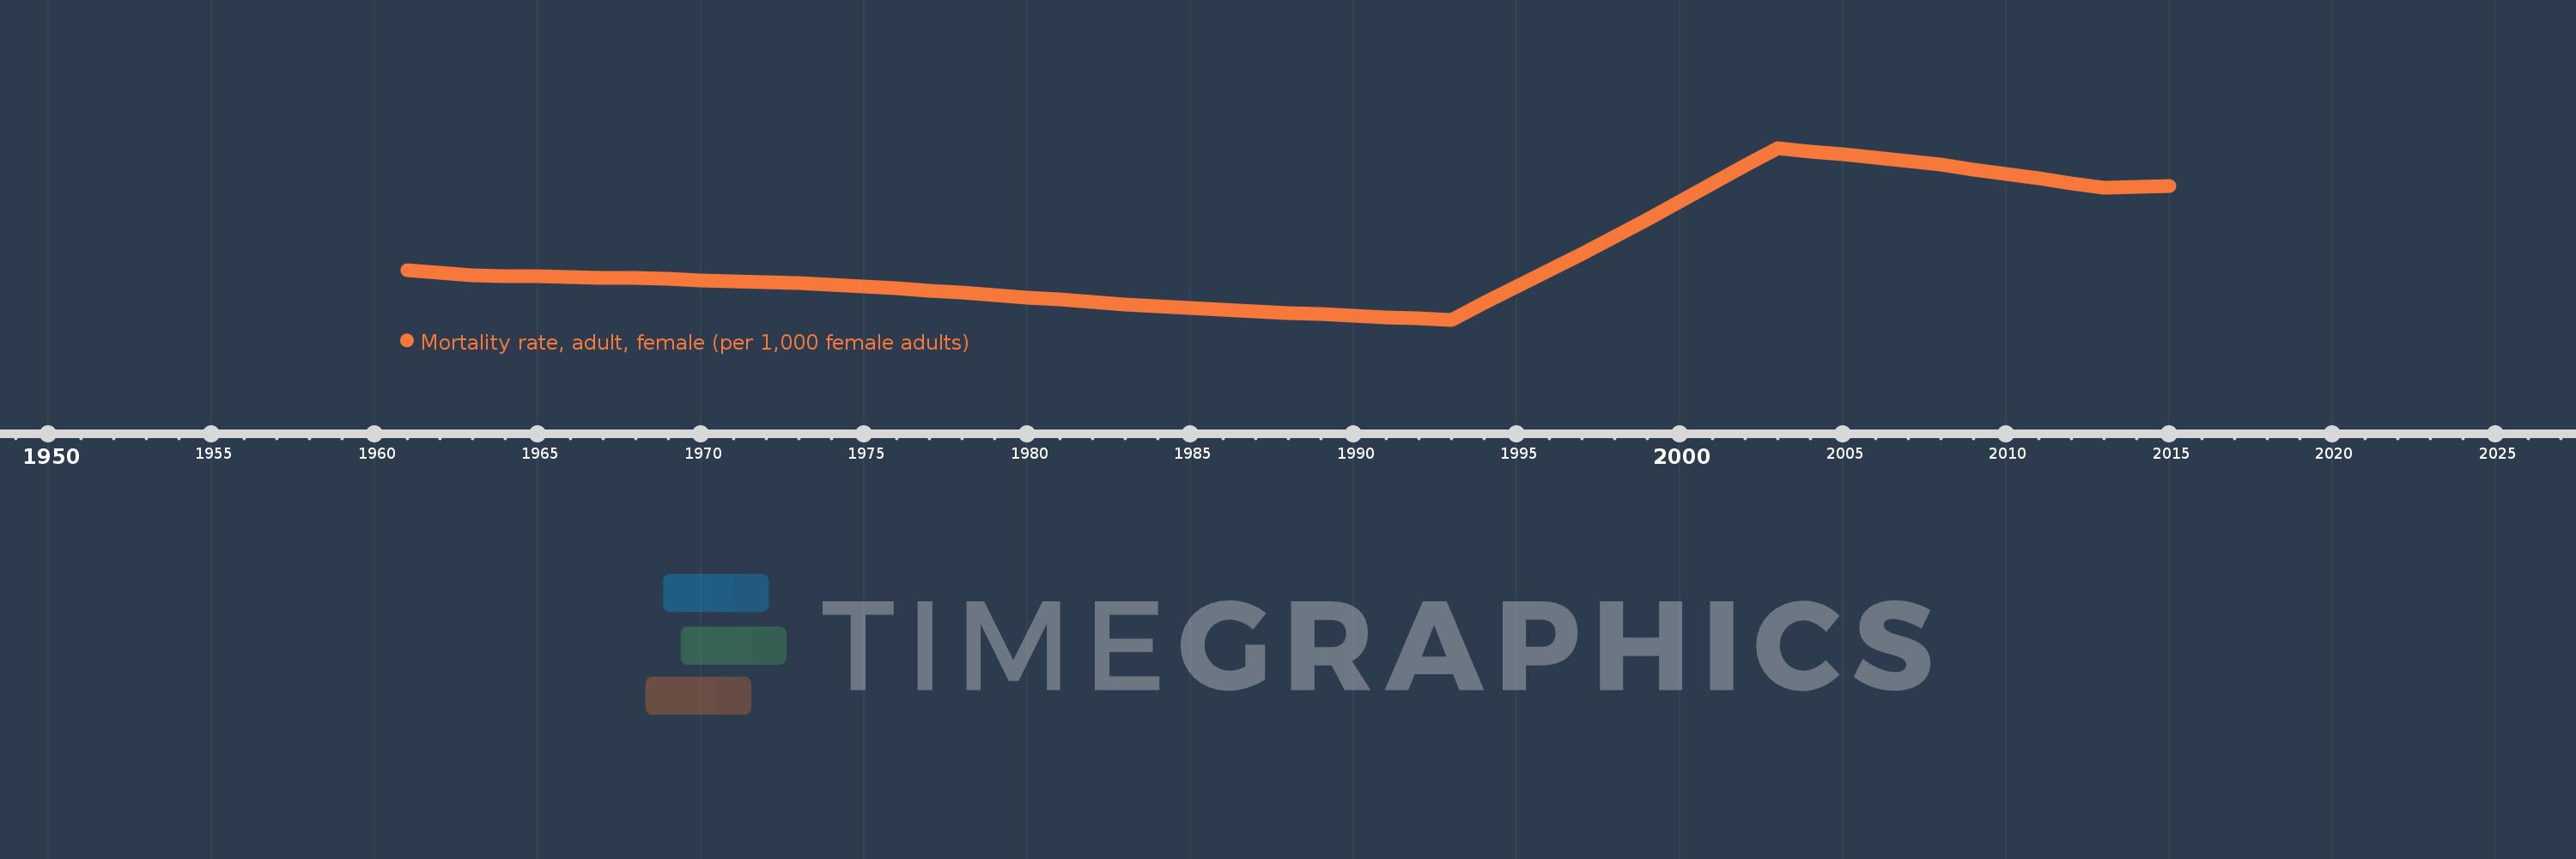
Mortality rate, adult, female (per 1,000 female adults)
2015,2014,2013,2012,2011,2010,2009,2008,2007,2006,2005,2004,2003,2002,2001,2000,1999,1998,1997,1996,1995,1994,1993,1992,1991,1990,1989,1988,1987,1986,1985,1984,1983,1982,1981,1980,1979,1978,1977,1976,1975,1974,1973,1972,1971,1970,1969,1968,1967,1966,1965,1964,1963,1962,1961
This statistics in other country:
AfghanistanAlbaniaAlgeriaAngolaAntigua and BarbudaArab WorldArgentinaArmeniaArubaAustraliaAustriaAzerbaijanBahamas, TheBahrainBangladeshBarbadosBelarusBelgiumBelizeBeninBhutanBoliviaBosnia and HerzegovinaBotswanaBrazilBrunei DarussalamBulgariaBurkina FasoBurundiCabo VerdeCambodiaCameroonCanadaCaribbean small statesCentral African RepublicCentral Europe and the BalticsChadChannel IslandsChileChinaColombiaComorosCongo, Dem. Rep.Congo, Rep.Costa RicaCote d'IvoireCroatiaCubaCuracaoCyprusCzech RepublicDenmarkDjiboutiDominicaDominican RepublicEarly-demographic dividendEast Asia & PacificEast Asia & Pacific (excluding high income)East Asia & Pacific (IDA & IBRD countries)EcuadorEgypt, Arab Rep.El SalvadorEquatorial GuineaEritreaEstoniaEthiopiaEuro areaEurope & Central AsiaEurope & Central Asia (excluding high income)Europe & Central Asia (IDA & IBRD countries)European UnionFijiFinlandFragile and conflict affected situationsFranceFrench PolynesiaGabonGambia, TheGeorgiaGermanyGhanaGreeceGreenlandGrenadaGuamGuatemalaGuineaGuinea-BissauGuyanaHaitiHeavily indebted poor countries (HIPC)High incomeHondurasHong Kong SAR, ChinaHungaryIBRD onlyIcelandIDA & IBRD totalIDA blendIDA onlyIDA totalIndiaIndonesiaIran, Islamic Rep.IraqIrelandIsraelItalyJamaicaJapanJordanKazakhstanKenyaKiribatiKorea, Dem. People’s Rep.Korea, Rep.KuwaitKyrgyz RepublicLao PDRLate-demographic dividendLatin America & Caribbean Latin America & Caribbean (excluding high income)Latin America & the Caribbean (IDA & IBRD countries)LatviaLeast developed countries: UN classificationLebanonLesothoLiberiaLibyaLithuaniaLow & middle incomeLow incomeLower middle incomeLuxembourgMacao SAR, ChinaMacedonia, FYRMadagascarMalawiMalaysiaMaldivesMaliMaltaMarshall IslandsMauritaniaMauritiusMexicoMicronesia, Fed. Sts.Middle East & North AfricaMiddle East & North Africa (excluding high income)Middle East & North Africa (IDA & IBRD countries)Middle incomeMoldovaMongoliaMontenegroMoroccoMozambiqueMyanmarNamibiaNepalNetherlandsNew CaledoniaNew ZealandNicaraguaNigerNigeriaNorth AmericaNorwayOECD membersOmanOther small statesPacific island small statesPakistanPanamaPapua New GuineaParaguayPeruPhilippinesPolandPortugalPost-demographic dividendPre-demographic dividendPuerto RicoQatarRomaniaRussian FederationRwandaSamoaSao Tome and PrincipeSaudi ArabiaSenegalSerbiaSeychellesSierra LeoneSingaporeSlovak RepublicSloveniaSmall statesSolomon IslandsSomaliaSouth AfricaSouth AsiaSouth Asia (IDA & IBRD)South SudanSpainSri LankaSt. Kitts and NevisSt. LuciaSt. Vincent and the GrenadinesSub-Saharan Africa Sub-Saharan Africa (excluding high income)Sub-Saharan Africa (IDA & IBRD countries)SudanSurinameSwazilandSwedenSwitzerlandSyrian Arab RepublicTajikistanTanzaniaThailandTimor-LesteTogoTongaTrinidad and TobagoTunisiaTurkeyTurkmenistanUgandaUkraineUnited Arab EmiratesUnited KingdomUnited StatesUpper middle incomeUruguayUzbekistanVanuatuVenezuela, RBVietnamVirgin Islands (U.S.)West Bank and GazaWorldYemen, Rep.ZambiaZimbabwe Timeline:
This timeline shows a graph from 1961 to 2015 of Lesotho. No data until 1960. Number of actual observations by date: 55.
Source name:
World Development Indicators
Source organization:
(1) United Nations Population Division. World Population Prospects. New York, United Nations, Department of Economic and Social Affairs (advanced Excel tables). Available at http://esa.un.org/wpp/unpp/panel_population.htm, (2) University of California, Berkeley, and Max Planck Institute for Demographic Research. Human Mortality Database. [ www.mortality.org or www.humanmortality.de].
Categories, topics:
Health, Gender
Last updated:
apr 23, 2017
Indicators value changes by year
Minimum:
254.935
jan 1, 1993
Maximum:
695.582
jan 1, 2003
At the date of observation
Value
Absolute change
Change from previous value
jan 1, 1961
381.069
+381.069
0.0%
jan 1, 1962
375.132
-5.937
-1.56%
jan 1, 1963
369.195
-5.937
-1.58%
jan 1, 1964
367.648
-1.547
-0.42%
jan 1, 1965
366.102
-1.546
-0.42%
jan 1, 1966
364.556
-1.546
-0.42%
jan 1, 1967
363.01
-1.546
-0.42%
jan 1, 1968
361.464
-1.546
-0.43%
jan 1, 1969
359.055
-2.409
-0.67%
jan 1, 1970
356.646
-2.409
-0.67%
jan 1, 1971
354.237
-2.409
-0.68%
jan 1, 1972
351.828
-2.409
-0.68%
jan 1, 1973
349.42
-2.408
-0.68%
jan 1, 1974
344.63
-4.79
-1.37%
jan 1, 1975
339.84
-4.79
-1.39%
jan 1, 1976
335.05
-4.79
-1.41%
jan 1, 1977
330.26
-4.79
-1.43%
jan 1, 1978
325.47
-4.79
-1.45%
jan 1, 1979
319.015
-6.455
-1.98%
jan 1, 1980
312.561
-6.454
-2.02%
jan 1, 1981
306.106
-6.455
-2.07%
jan 1, 1982
299.651
-6.455
-2.11%
jan 1, 1983
293.197
-6.454
-2.15%
jan 1, 1984
289.014
-4.183
-1.43%
jan 1, 1985
284.832
-4.182
-1.45%
jan 1, 1986
280.65
-4.182
-1.47%
jan 1, 1987
276.467
-4.183
-1.49%
jan 1, 1988
272.285
-4.182
-1.51%
jan 1, 1989
268.815
-3.47
-1.27%
jan 1, 1990
265.345
-3.47
-1.29%
jan 1, 1991
261.875
-3.47
-1.31%
jan 1, 1992
258.405
-3.47
-1.33%
jan 1, 1993
254.935
-3.47
-1.34%
jan 1, 1994
297.392
+42.457
16.65%
jan 1, 1995
339.85
+42.458
14.28%
jan 1, 1996
382.308
+42.458
12.49%
jan 1, 1997
424.765
+42.457
11.11%
jan 1, 1998
467.223
+42.458
10.0%
jan 1, 1999
512.895
+45.672
9.78%
jan 1, 2000
558.567
+45.672
8.9%
jan 1, 2001
604.238
+45.671
8.18%
jan 1, 2002
649.91
+45.672
7.56%
jan 1, 2003
695.582
+45.672
7.03%
jan 1, 2004
687.023
-8.559
-1.23%
jan 1, 2005
678.463
-8.56
-1.25%
jan 1, 2006
669.904
-8.559
-1.26%
jan 1, 2007
661.344
-8.56
-1.28%
jan 1, 2008
652.785
-8.559
-1.29%
jan 1, 2009
640.806
-11.979
-1.84%
jan 1, 2010
628.827
-11.979
-1.87%
jan 1, 2011
616.849
-11.978
-1.9%
jan 1, 2012
604.87
-11.979
-1.94%
jan 1, 2013
592.891
-11.979
-1.98%
jan 1, 2014
595.739
+2.848
0.48%
jan 1, 2015
598.587
+2.848
0.48%
Ranking of countries by current statistics by years


Comments: