29
/
en
AIzaSyAYiBZKx7MnpbEhh9jyipgxe19OcubqV5w
April 1, 2024
186816
Malawi
MWI
true
2
1
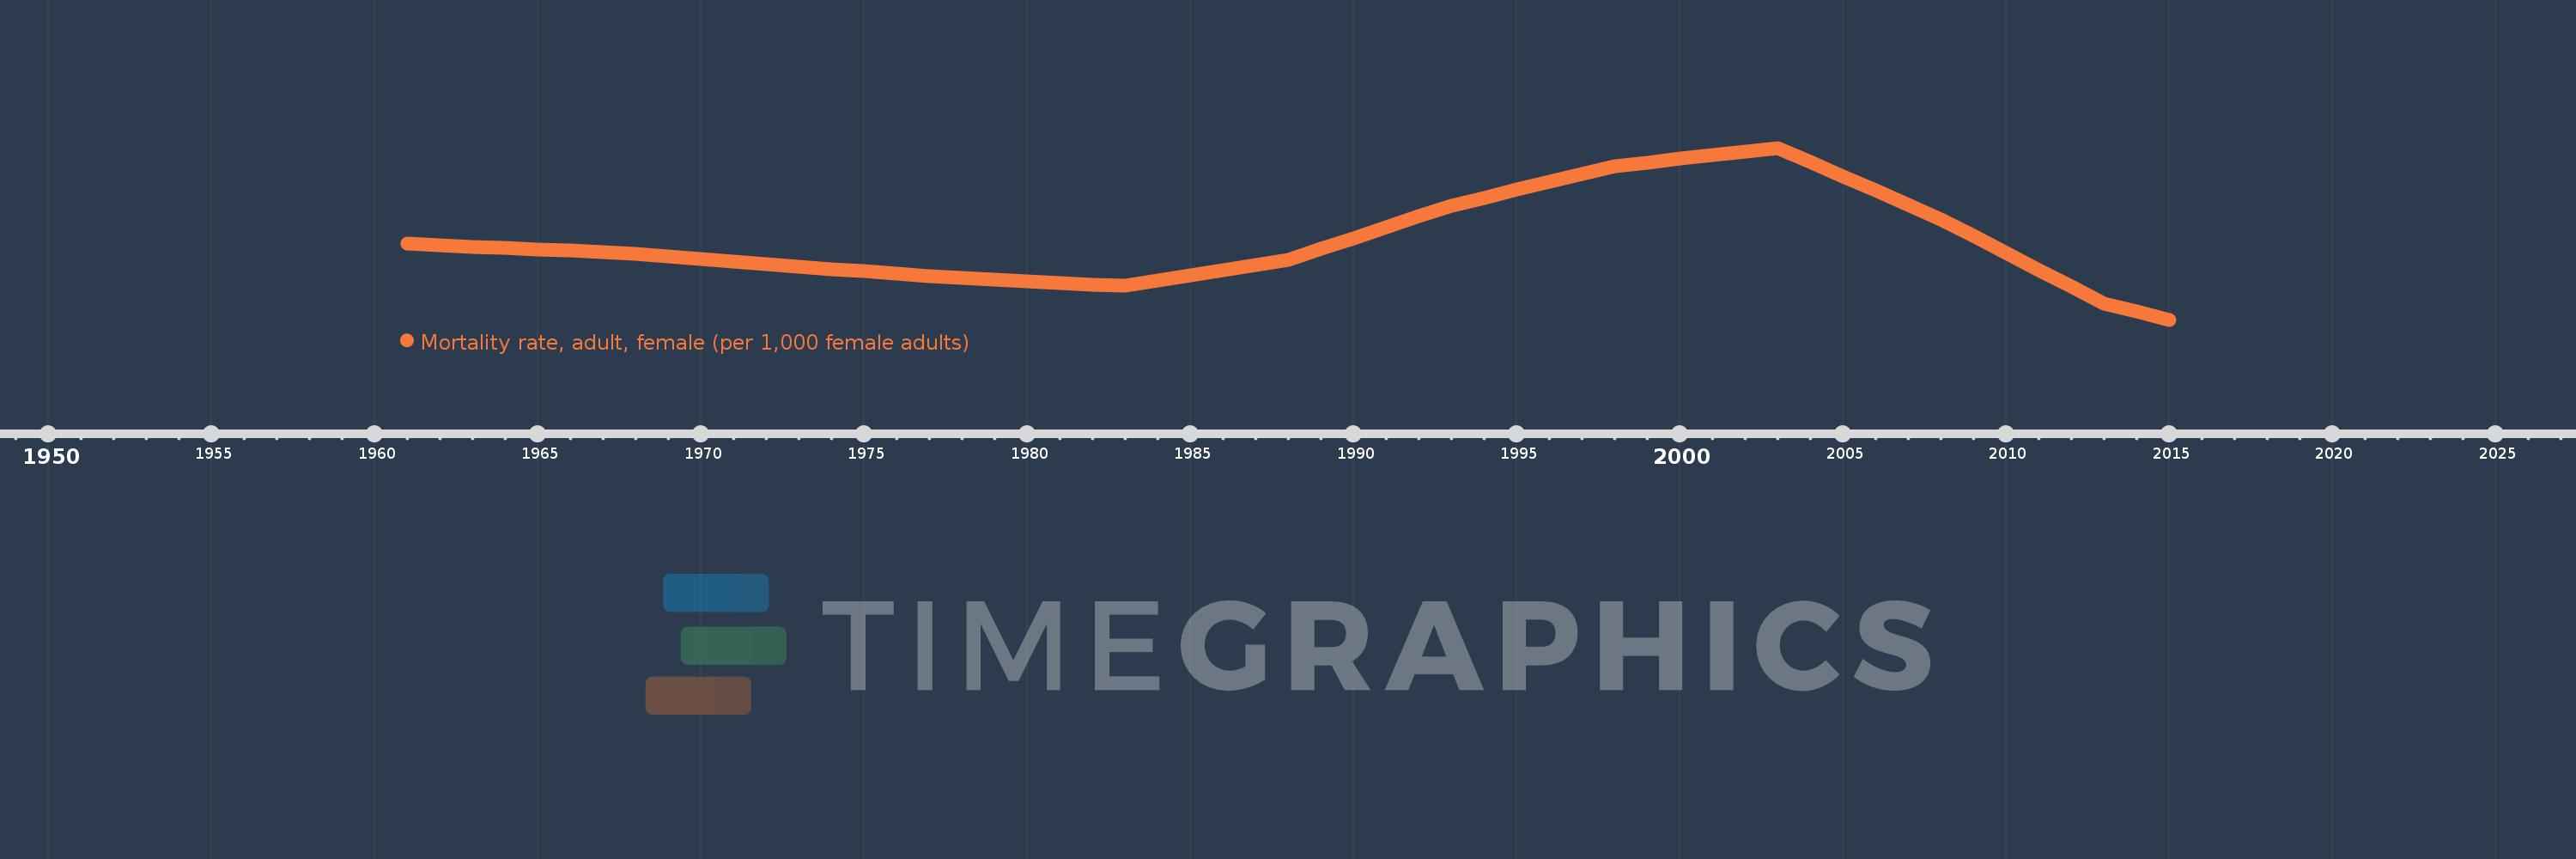
Mortality rate, adult, female (per 1,000 female adults)
2015,2014,2013,2012,2011,2010,2009,2008,2007,2006,2005,2004,2003,2002,2001,2000,1999,1998,1997,1996,1995,1994,1993,1992,1991,1990,1989,1988,1987,1986,1985,1984,1983,1982,1981,1980,1979,1978,1977,1976,1975,1974,1973,1972,1971,1970,1969,1968,1967,1966,1965,1964,1963,1962,1961
This statistics in other country:
AfghanistanAlbaniaAlgeriaAngolaAntigua and BarbudaArab WorldArgentinaArmeniaArubaAustraliaAustriaAzerbaijanBahamas, TheBahrainBangladeshBarbadosBelarusBelgiumBelizeBeninBhutanBoliviaBosnia and HerzegovinaBotswanaBrazilBrunei DarussalamBulgariaBurkina FasoBurundiCabo VerdeCambodiaCameroonCanadaCaribbean small statesCentral African RepublicCentral Europe and the BalticsChadChannel IslandsChileChinaColombiaComorosCongo, Dem. Rep.Congo, Rep.Costa RicaCote d'IvoireCroatiaCubaCuracaoCyprusCzech RepublicDenmarkDjiboutiDominicaDominican RepublicEarly-demographic dividendEast Asia & PacificEast Asia & Pacific (excluding high income)East Asia & Pacific (IDA & IBRD countries)EcuadorEgypt, Arab Rep.El SalvadorEquatorial GuineaEritreaEstoniaEthiopiaEuro areaEurope & Central AsiaEurope & Central Asia (excluding high income)Europe & Central Asia (IDA & IBRD countries)European UnionFijiFinlandFragile and conflict affected situationsFranceFrench PolynesiaGabonGambia, TheGeorgiaGermanyGhanaGreeceGreenlandGrenadaGuamGuatemalaGuineaGuinea-BissauGuyanaHaitiHeavily indebted poor countries (HIPC)High incomeHondurasHong Kong SAR, ChinaHungaryIBRD onlyIcelandIDA & IBRD totalIDA blendIDA onlyIDA totalIndiaIndonesiaIran, Islamic Rep.IraqIrelandIsraelItalyJamaicaJapanJordanKazakhstanKenyaKiribatiKorea, Dem. People’s Rep.Korea, Rep.KuwaitKyrgyz RepublicLao PDRLate-demographic dividendLatin America & Caribbean Latin America & Caribbean (excluding high income)Latin America & the Caribbean (IDA & IBRD countries)LatviaLeast developed countries: UN classificationLebanonLesothoLiberiaLibyaLithuaniaLow & middle incomeLow incomeLower middle incomeLuxembourgMacao SAR, ChinaMacedonia, FYRMadagascarMalawiMalaysiaMaldivesMaliMaltaMarshall IslandsMauritaniaMauritiusMexicoMicronesia, Fed. Sts.Middle East & North AfricaMiddle East & North Africa (excluding high income)Middle East & North Africa (IDA & IBRD countries)Middle incomeMoldovaMongoliaMontenegroMoroccoMozambiqueMyanmarNamibiaNepalNetherlandsNew CaledoniaNew ZealandNicaraguaNigerNigeriaNorth AmericaNorwayOECD membersOmanOther small statesPacific island small statesPakistanPanamaPapua New GuineaParaguayPeruPhilippinesPolandPortugalPost-demographic dividendPre-demographic dividendPuerto RicoQatarRomaniaRussian FederationRwandaSamoaSao Tome and PrincipeSaudi ArabiaSenegalSerbiaSeychellesSierra LeoneSingaporeSlovak RepublicSloveniaSmall statesSolomon IslandsSomaliaSouth AfricaSouth AsiaSouth Asia (IDA & IBRD)South SudanSpainSri LankaSt. Kitts and NevisSt. LuciaSt. Vincent and the GrenadinesSub-Saharan Africa Sub-Saharan Africa (excluding high income)Sub-Saharan Africa (IDA & IBRD countries)SudanSurinameSwazilandSwedenSwitzerlandSyrian Arab RepublicTajikistanTanzaniaThailandTimor-LesteTogoTongaTrinidad and TobagoTunisiaTurkeyTurkmenistanUgandaUkraineUnited Arab EmiratesUnited KingdomUnited StatesUpper middle incomeUruguayUzbekistanVanuatuVenezuela, RBVietnamVirgin Islands (U.S.)West Bank and GazaWorldYemen, Rep.ZambiaZimbabwe Timeline:
This timeline shows a graph from 1961 to 2015 of Malawi. No data until 1960. Number of actual observations by date: 55.
Source name:
World Development Indicators
Source organization:
(1) United Nations Population Division. World Population Prospects. New York, United Nations, Department of Economic and Social Affairs (advanced Excel tables). Available at http://esa.un.org/wpp/unpp/panel_population.htm, (2) University of California, Berkeley, and Max Planck Institute for Demographic Research. Human Mortality Database. [ www.mortality.org or www.humanmortality.de].
Categories, topics:
Health, Gender
Last updated:
apr 23, 2017
Indicators value changes by year
Minimum:
262.173
jan 1, 2015
Maximum:
577.592
jan 1, 2003
At the date of observation
Value
Absolute change
Change from previous value
jan 1, 1961
401.874
+401.874
0.0%
jan 1, 1962
399.024
-2.85
-0.71%
jan 1, 1963
396.175
-2.849
-0.71%
jan 1, 1964
393.7
-2.475
-0.62%
jan 1, 1965
391.225
-2.475
-0.63%
jan 1, 1966
388.75
-2.475
-0.63%
jan 1, 1967
386.275
-2.475
-0.64%
jan 1, 1968
383.8
-2.475
-0.64%
jan 1, 1969
379.007
-4.793
-1.25%
jan 1, 1970
374.214
-4.793
-1.26%
jan 1, 1971
369.421
-4.793
-1.28%
jan 1, 1972
364.628
-4.793
-1.3%
jan 1, 1973
359.836
-4.792
-1.31%
jan 1, 1974
355.512
-4.324
-1.2%
jan 1, 1975
351.188
-4.324
-1.22%
jan 1, 1976
346.864
-4.324
-1.23%
jan 1, 1977
342.54
-4.324
-1.25%
jan 1, 1978
338.216
-4.324
-1.26%
jan 1, 1979
335.429
-2.787
-0.82%
jan 1, 1980
332.642
-2.787
-0.83%
jan 1, 1981
329.854
-2.788
-0.84%
jan 1, 1982
327.067
-2.787
-0.84%
jan 1, 1983
324.28
-2.787
-0.85%
jan 1, 1984
333.962
+9.682
2.99%
jan 1, 1985
343.644
+9.682
2.9%
jan 1, 1986
353.326
+9.682
2.82%
jan 1, 1987
363.008
+9.682
2.74%
jan 1, 1988
372.69
+9.682
2.67%
jan 1, 1989
392.491
+19.801
5.31%
jan 1, 1990
412.293
+19.802
5.05%
jan 1, 1991
432.094
+19.801
4.8%
jan 1, 1992
451.896
+19.802
4.58%
jan 1, 1993
471.697
+19.801
4.38%
jan 1, 1994
486.174
+14.477
3.07%
jan 1, 1995
500.65
+14.476
2.98%
jan 1, 1996
515.127
+14.477
2.89%
jan 1, 1997
529.604
+14.477
2.81%
jan 1, 1998
544.08
+14.476
2.73%
jan 1, 1999
550.783
+6.703
1.23%
jan 1, 2000
557.485
+6.702
1.22%
jan 1, 2001
564.188
+6.703
1.2%
jan 1, 2002
570.89
+6.702
1.19%
jan 1, 2003
577.592
+6.702
1.17%
jan 1, 2004
551.439
-26.153
-4.53%
jan 1, 2005
525.286
-26.153
-4.74%
jan 1, 2006
499.133
-26.153
-4.98%
jan 1, 2007
472.98
-26.153
-5.24%
jan 1, 2008
446.828
-26.152
-5.53%
jan 1, 2009
415.743
-31.085
-6.96%
jan 1, 2010
384.659
-31.084
-7.48%
jan 1, 2011
353.575
-31.084
-8.08%
jan 1, 2012
322.491
-31.084
-8.79%
jan 1, 2013
291.407
-31.084
-9.64%
jan 1, 2014
276.79
-14.617
-5.02%
jan 1, 2015
262.173
-14.617
-5.28%
Ranking of countries by current statistics by years


Comments: