29
/
en
AIzaSyAYiBZKx7MnpbEhh9jyipgxe19OcubqV5w
April 1, 2024
49246
Middle East & North Africa (excluding high income)
MNA
false
2
1
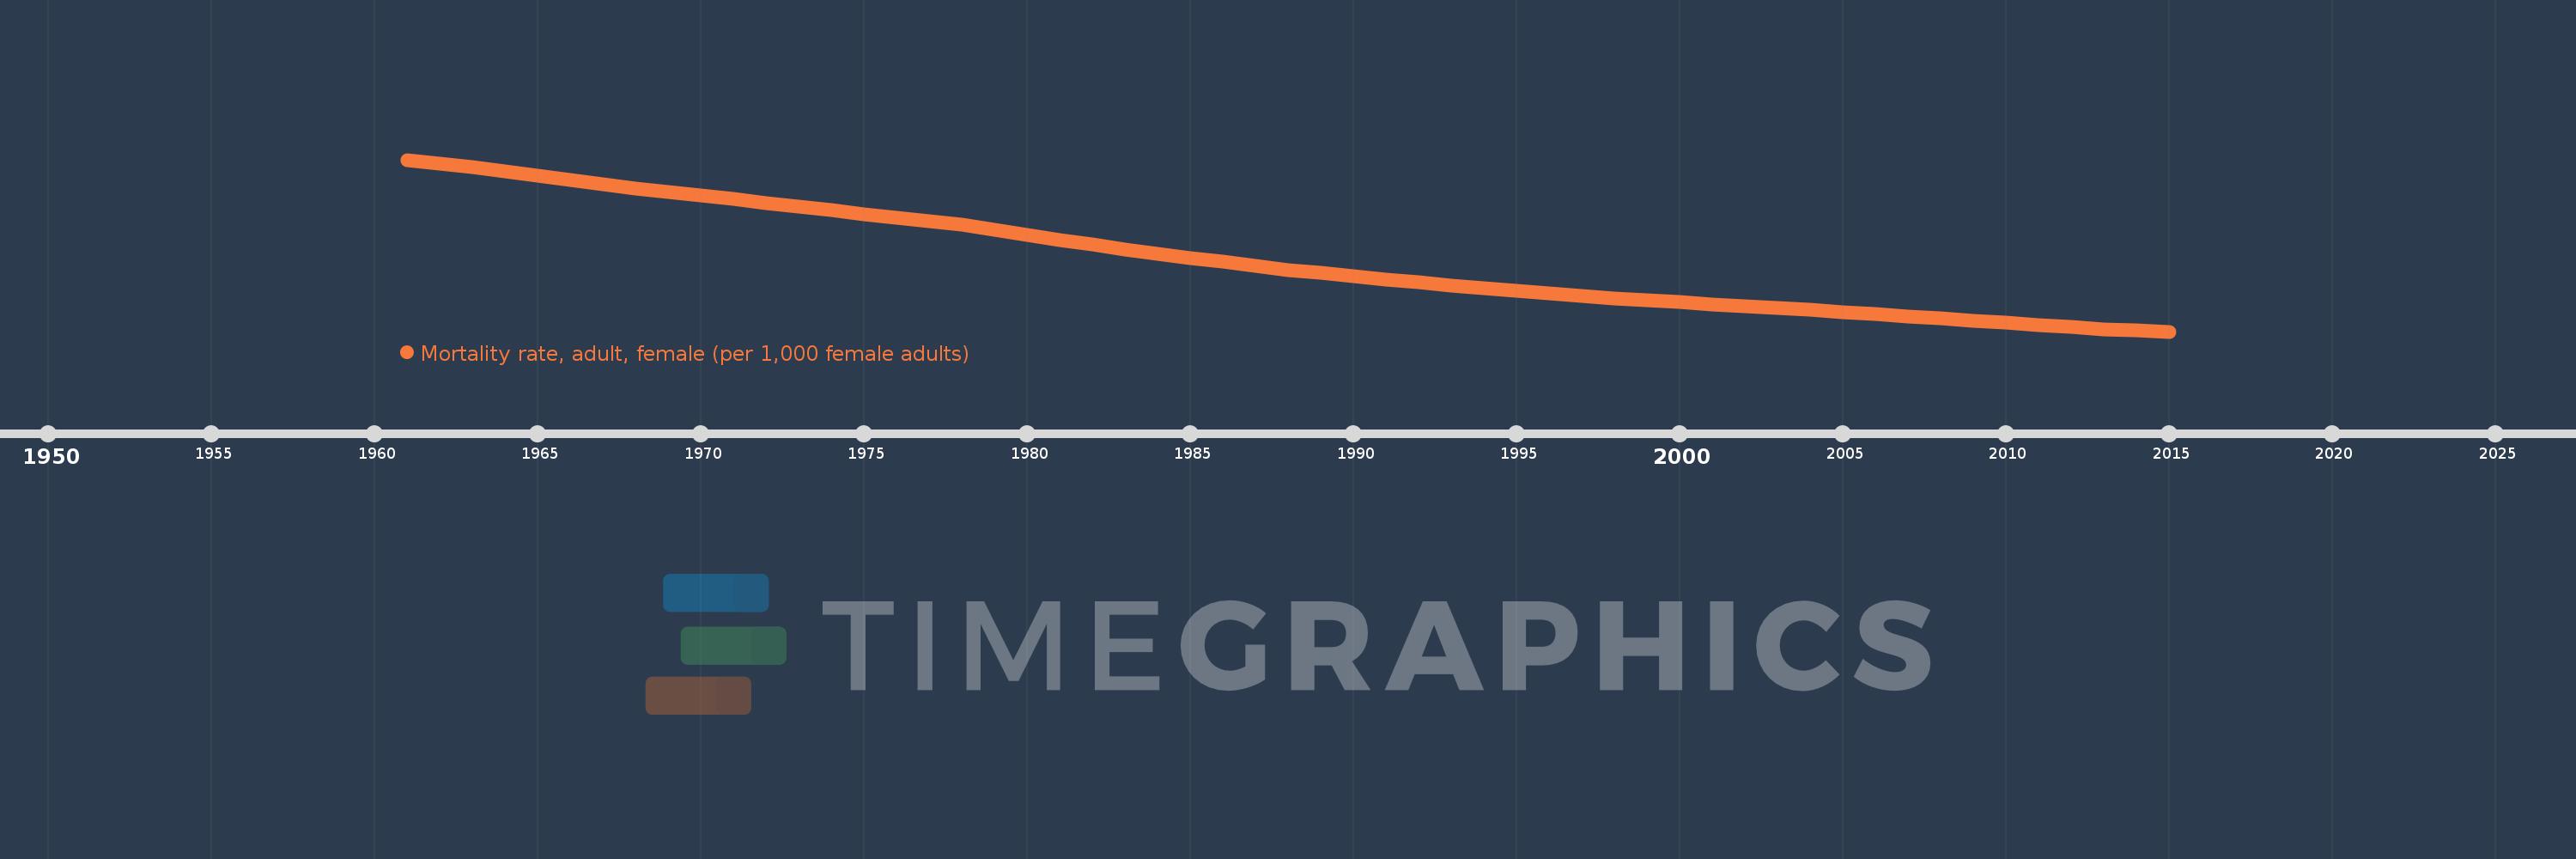
Mortality rate, adult, female (per 1,000 female adults)
2015,2014,2013,2012,2011,2010,2009,2008,2007,2006,2005,2004,2003,2002,2001,2000,1999,1998,1997,1996,1995,1994,1993,1992,1991,1990,1989,1988,1987,1986,1985,1984,1983,1982,1981,1980,1979,1978,1977,1976,1975,1974,1973,1972,1971,1970,1969,1968,1967,1966,1965,1964,1963,1962,1961
This statistics in other country:
AfghanistanAlbaniaAlgeriaAngolaAntigua and BarbudaArab WorldArgentinaArmeniaArubaAustraliaAustriaAzerbaijanBahamas, TheBahrainBangladeshBarbadosBelarusBelgiumBelizeBeninBhutanBoliviaBosnia and HerzegovinaBotswanaBrazilBrunei DarussalamBulgariaBurkina FasoBurundiCabo VerdeCambodiaCameroonCanadaCaribbean small statesCentral African RepublicCentral Europe and the BalticsChadChannel IslandsChileChinaColombiaComorosCongo, Dem. Rep.Congo, Rep.Costa RicaCote d'IvoireCroatiaCubaCuracaoCyprusCzech RepublicDenmarkDjiboutiDominicaDominican RepublicEarly-demographic dividendEast Asia & PacificEast Asia & Pacific (excluding high income)East Asia & Pacific (IDA & IBRD countries)EcuadorEgypt, Arab Rep.El SalvadorEquatorial GuineaEritreaEstoniaEthiopiaEuro areaEurope & Central AsiaEurope & Central Asia (excluding high income)Europe & Central Asia (IDA & IBRD countries)European UnionFijiFinlandFragile and conflict affected situationsFranceFrench PolynesiaGabonGambia, TheGeorgiaGermanyGhanaGreeceGreenlandGrenadaGuamGuatemalaGuineaGuinea-BissauGuyanaHaitiHeavily indebted poor countries (HIPC)High incomeHondurasHong Kong SAR, ChinaHungaryIBRD onlyIcelandIDA & IBRD totalIDA blendIDA onlyIDA totalIndiaIndonesiaIran, Islamic Rep.IraqIrelandIsraelItalyJamaicaJapanJordanKazakhstanKenyaKiribatiKorea, Dem. People’s Rep.Korea, Rep.KuwaitKyrgyz RepublicLao PDRLate-demographic dividendLatin America & Caribbean Latin America & Caribbean (excluding high income)Latin America & the Caribbean (IDA & IBRD countries)LatviaLeast developed countries: UN classificationLebanonLesothoLiberiaLibyaLithuaniaLow & middle incomeLow incomeLower middle incomeLuxembourgMacao SAR, ChinaMacedonia, FYRMadagascarMalawiMalaysiaMaldivesMaliMaltaMarshall IslandsMauritaniaMauritiusMexicoMicronesia, Fed. Sts.Middle East & North AfricaMiddle East & North Africa (excluding high income)Middle East & North Africa (IDA & IBRD countries)Middle incomeMoldovaMongoliaMontenegroMoroccoMozambiqueMyanmarNamibiaNepalNetherlandsNew CaledoniaNew ZealandNicaraguaNigerNigeriaNorth AmericaNorwayOECD membersOmanOther small statesPacific island small statesPakistanPanamaPapua New GuineaParaguayPeruPhilippinesPolandPortugalPost-demographic dividendPre-demographic dividendPuerto RicoQatarRomaniaRussian FederationRwandaSamoaSao Tome and PrincipeSaudi ArabiaSenegalSerbiaSeychellesSierra LeoneSingaporeSlovak RepublicSloveniaSmall statesSolomon IslandsSomaliaSouth AfricaSouth AsiaSouth Asia (IDA & IBRD)South SudanSpainSri LankaSt. Kitts and NevisSt. LuciaSt. Vincent and the GrenadinesSub-Saharan Africa Sub-Saharan Africa (excluding high income)Sub-Saharan Africa (IDA & IBRD countries)SudanSurinameSwazilandSwedenSwitzerlandSyrian Arab RepublicTajikistanTanzaniaThailandTimor-LesteTogoTongaTrinidad and TobagoTunisiaTurkeyTurkmenistanUgandaUkraineUnited Arab EmiratesUnited KingdomUnited StatesUpper middle incomeUruguayUzbekistanVanuatuVenezuela, RBVietnamVirgin Islands (U.S.)West Bank and GazaWorldYemen, Rep.ZambiaZimbabwe Timeline:
This timeline shows a graph from 1961 to 2015 of Middle East & North Africa (excluding high income). No data until 1960. Number of actual observations by date: 55.
Source name:
World Development Indicators
Source organization:
(1) United Nations Population Division. World Population Prospects. New York, United Nations, Department of Economic and Social Affairs (advanced Excel tables). Available at http://esa.un.org/wpp/unpp/panel_population.htm, (2) University of California, Berkeley, and Max Planck Institute for Demographic Research. Human Mortality Database. [ www.mortality.org or www.humanmortality.de].
Categories, topics:
Health, Gender
Last updated:
apr 23, 2017
Indicators value changes by year
Minimum:
98.392
jan 1, 2015
Maximum:
307.284
jan 1, 1961
At the date of observation
Value
Absolute change
Change from previous value
jan 1, 1961
307.284
+307.284
0.0%
jan 1, 1962
302.987
-4.297
-1.4%
jan 1, 1963
298.469
-4.519
-1.49%
jan 1, 1964
293.078
-5.391
-1.81%
jan 1, 1965
287.785
-5.293
-1.81%
jan 1, 1966
282.66
-5.125
-1.78%
jan 1, 1967
277.633
-5.027
-1.78%
jan 1, 1968
272.738
-4.895
-1.76%
jan 1, 1969
268.284
-4.454
-1.63%
jan 1, 1970
263.799
-4.485
-1.67%
jan 1, 1971
259.247
-4.551
-1.73%
jan 1, 1972
254.681
-4.567
-1.76%
jan 1, 1973
250.088
-4.593
-1.8%
jan 1, 1974
245.673
-4.415
-1.77%
jan 1, 1975
241.281
-4.392
-1.79%
jan 1, 1976
236.924
-4.357
-1.81%
jan 1, 1977
232.632
-4.293
-1.81%
jan 1, 1978
228.361
-4.271
-1.84%
jan 1, 1979
222.294
-6.067
-2.66%
jan 1, 1980
216.212
-6.081
-2.74%
jan 1, 1981
210.109
-6.104
-2.82%
jan 1, 1982
203.96
-6.149
-2.93%
jan 1, 1983
197.789
-6.17
-3.03%
jan 1, 1984
192.94
-4.849
-2.45%
jan 1, 1985
188.079
-4.861
-2.52%
jan 1, 1986
183.205
-4.874
-2.59%
jan 1, 1987
178.291
-4.913
-2.68%
jan 1, 1988
173.388
-4.903
-2.75%
jan 1, 1989
169.587
-3.801
-2.19%
jan 1, 1990
165.783
-3.804
-2.24%
jan 1, 1991
161.899
-3.884
-2.34%
jan 1, 1992
158.042
-3.856
-2.38%
jan 1, 1993
154.164
-3.878
-2.45%
jan 1, 1994
151.045
-3.119
-2.02%
jan 1, 1995
147.915
-3.13
-2.07%
jan 1, 1996
144.805
-3.11
-2.1%
jan 1, 1997
141.692
-3.113
-2.15%
jan 1, 1998
138.583
-3.109
-2.19%
jan 1, 1999
136.331
-2.252
-1.63%
jan 1, 2000
134.067
-2.264
-1.66%
jan 1, 2001
131.799
-2.268
-1.69%
jan 1, 2002
129.554
-2.245
-1.7%
jan 1, 2003
127.292
-2.262
-1.75%
jan 1, 2004
124.764
-2.528
-1.99%
jan 1, 2005
122.238
-2.526
-2.02%
jan 1, 2006
119.717
-2.521
-2.06%
jan 1, 2007
117.187
-2.53
-2.11%
jan 1, 2008
114.676
-2.511
-2.14%
jan 1, 2009
111.878
-2.798
-2.44%
jan 1, 2010
109.116
-2.761
-2.47%
jan 1, 2011
106.386
-2.73
-2.5%
jan 1, 2012
103.7
-2.686
-2.52%
jan 1, 2013
101.012
-2.688
-2.59%
jan 1, 2014
99.698
-1.314
-1.3%
jan 1, 2015
98.392
-1.305
-1.31%
Ranking of countries by current statistics by years


Comments: