29
/
en
AIzaSyAYiBZKx7MnpbEhh9jyipgxe19OcubqV5w
April 1, 2024
55010
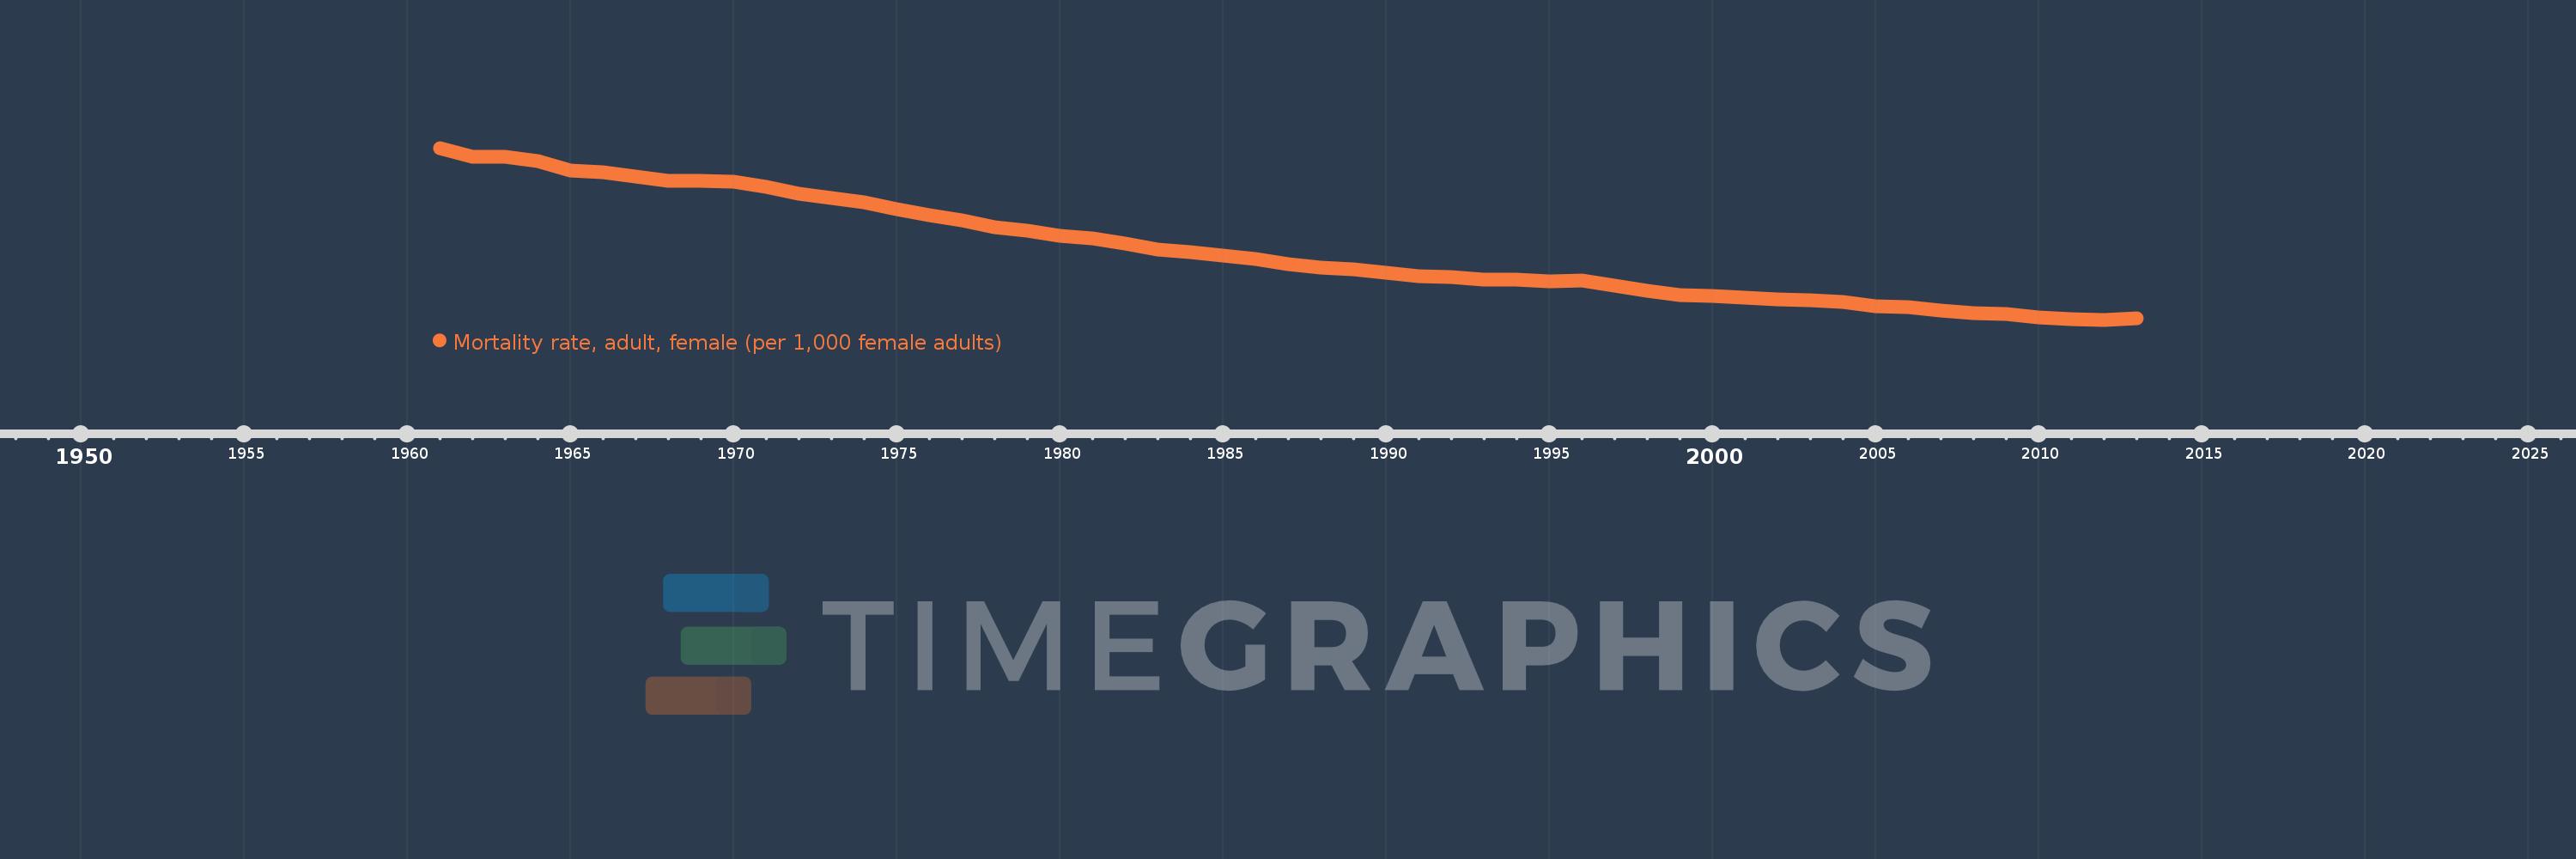
Post-demographic dividend
PST
false
2
1
Mortality rate, adult, female (per 1,000 female adults)
2013,2012,2011,2010,2009,2008,2007,2006,2005,2004,2003,2002,2001,2000,1999,1998,1997,1996,1995,1994,1993,1992,1991,1990,1989,1988,1987,1986,1985,1984,1983,1982,1981,1980,1979,1978,1977,1976,1975,1974,1973,1972,1971,1970,1969,1968,1967,1966,1965,1964,1963,1962,1961
This statistics in other country:
AfghanistanAlbaniaAlgeriaAngolaAntigua and BarbudaArab WorldArgentinaArmeniaArubaAustraliaAustriaAzerbaijanBahamas, TheBahrainBangladeshBarbadosBelarusBelgiumBelizeBeninBhutanBoliviaBosnia and HerzegovinaBotswanaBrazilBrunei DarussalamBulgariaBurkina FasoBurundiCabo VerdeCambodiaCameroonCanadaCaribbean small statesCentral African RepublicCentral Europe and the BalticsChadChannel IslandsChileChinaColombiaComorosCongo, Dem. Rep.Congo, Rep.Costa RicaCote d'IvoireCroatiaCubaCuracaoCyprusCzech RepublicDenmarkDjiboutiDominicaDominican RepublicEarly-demographic dividendEast Asia & PacificEast Asia & Pacific (excluding high income)East Asia & Pacific (IDA & IBRD countries)EcuadorEgypt, Arab Rep.El SalvadorEquatorial GuineaEritreaEstoniaEthiopiaEuro areaEurope & Central AsiaEurope & Central Asia (excluding high income)Europe & Central Asia (IDA & IBRD countries)European UnionFijiFinlandFragile and conflict affected situationsFranceFrench PolynesiaGabonGambia, TheGeorgiaGermanyGhanaGreeceGreenlandGrenadaGuamGuatemalaGuineaGuinea-BissauGuyanaHaitiHeavily indebted poor countries (HIPC)High incomeHondurasHong Kong SAR, ChinaHungaryIBRD onlyIcelandIDA & IBRD totalIDA blendIDA onlyIDA totalIndiaIndonesiaIran, Islamic Rep.IraqIrelandIsraelItalyJamaicaJapanJordanKazakhstanKenyaKiribatiKorea, Dem. People’s Rep.Korea, Rep.KuwaitKyrgyz RepublicLao PDRLate-demographic dividendLatin America & Caribbean Latin America & Caribbean (excluding high income)Latin America & the Caribbean (IDA & IBRD countries)LatviaLeast developed countries: UN classificationLebanonLesothoLiberiaLibyaLithuaniaLow & middle incomeLow incomeLower middle incomeLuxembourgMacao SAR, ChinaMacedonia, FYRMadagascarMalawiMalaysiaMaldivesMaliMaltaMarshall IslandsMauritaniaMauritiusMexicoMicronesia, Fed. Sts.Middle East & North AfricaMiddle East & North Africa (excluding high income)Middle East & North Africa (IDA & IBRD countries)Middle incomeMoldovaMongoliaMontenegroMoroccoMozambiqueMyanmarNamibiaNepalNetherlandsNew CaledoniaNew ZealandNicaraguaNigerNigeriaNorth AmericaNorwayOECD membersOmanOther small statesPacific island small statesPakistanPanamaPapua New GuineaParaguayPeruPhilippinesPolandPortugalPost-demographic dividendPre-demographic dividendPuerto RicoQatarRomaniaRussian FederationRwandaSamoaSao Tome and PrincipeSaudi ArabiaSenegalSerbiaSeychellesSierra LeoneSingaporeSlovak RepublicSloveniaSmall statesSolomon IslandsSomaliaSouth AfricaSouth AsiaSouth Asia (IDA & IBRD)South SudanSpainSri LankaSt. Kitts and NevisSt. LuciaSt. Vincent and the GrenadinesSub-Saharan Africa Sub-Saharan Africa (excluding high income)Sub-Saharan Africa (IDA & IBRD countries)SudanSurinameSwazilandSwedenSwitzerlandSyrian Arab RepublicTajikistanTanzaniaThailandTimor-LesteTogoTongaTrinidad and TobagoTunisiaTurkeyTurkmenistanUgandaUkraineUnited Arab EmiratesUnited KingdomUnited StatesUpper middle incomeUruguayUzbekistanVanuatuVenezuela, RBVietnamVirgin Islands (U.S.)West Bank and GazaWorldYemen, Rep.ZambiaZimbabwe Timeline:
This timeline shows a graph from 1961 to 2013 of Post-demographic dividend. No data until 1960. Number of actual observations by date: 53.
Source name:
World Development Indicators
Source organization:
(1) United Nations Population Division. World Population Prospects. New York, United Nations, Department of Economic and Social Affairs (advanced Excel tables). Available at http://esa.un.org/wpp/unpp/panel_population.htm, (2) University of California, Berkeley, and Max Planck Institute for Demographic Research. Human Mortality Database. [ www.mortality.org or www.humanmortality.de].
Categories, topics:
Health, Gender
Last updated:
apr 23, 2017
Indicators value changes by year
Minimum:
62.122
jan 1, 2012
Maximum:
129.459
jan 1, 1961
At the date of observation
Value
Absolute change
Change from previous value
jan 1, 1961
129.459
+129.459
0.0%
jan 1, 1962
125.87
-3.589
-2.77%
jan 1, 1963
125.993
+0.122
0.1%
jan 1, 1964
124.243
-1.75
-1.39%
jan 1, 1965
120.72
-3.523
-2.84%
jan 1, 1966
120.017
-0.703
-0.58%
jan 1, 1967
118.105
-1.911
-1.59%
jan 1, 1968
116.458
-1.647
-1.39%
jan 1, 1969
116.486
+0.028
0.02%
jan 1, 1970
116.268
-0.218
-0.19%
jan 1, 1971
114.239
-2.029
-1.74%
jan 1, 1972
111.525
-2.714
-2.38%
jan 1, 1973
109.957
-1.568
-1.41%
jan 1, 1974
108.252
-1.705
-1.55%
jan 1, 1975
105.325
-2.927
-2.7%
jan 1, 1976
103.122
-2.204
-2.09%
jan 1, 1977
101.032
-2.089
-2.03%
jan 1, 1978
98.435
-2.597
-2.57%
jan 1, 1979
97.078
-1.358
-1.38%
jan 1, 1980
95.043
-2.035
-2.1%
jan 1, 1981
93.912
-1.13
-1.19%
jan 1, 1982
91.999
-1.913
-2.04%
jan 1, 1983
89.655
-2.344
-2.55%
jan 1, 1984
88.765
-0.891
-0.99%
jan 1, 1985
87.248
-1.517
-1.71%
jan 1, 1986
86.041
-1.207
-1.38%
jan 1, 1987
83.754
-2.287
-2.66%
jan 1, 1988
82.606
-1.148
-1.37%
jan 1, 1989
81.719
-0.888
-1.07%
jan 1, 1990
80.562
-1.156
-1.41%
jan 1, 1991
79.119
-1.443
-1.79%
jan 1, 1992
78.728
-0.391
-0.49%
jan 1, 1993
77.715
-1.013
-1.29%
jan 1, 1994
77.973
+0.258
0.33%
jan 1, 1995
77.173
-0.801
-1.03%
jan 1, 1996
77.474
+0.301
0.39%
jan 1, 1997
75.459
-2.014
-2.6%
jan 1, 1998
73.603
-1.856
-2.46%
jan 1, 1999
71.835
-1.768
-2.4%
jan 1, 2000
71.529
-0.306
-0.43%
jan 1, 2001
70.762
-0.767
-1.07%
jan 1, 2002
70.19
-0.572
-0.81%
jan 1, 2003
69.731
-0.459
-0.65%
jan 1, 2004
69.056
-0.675
-0.97%
jan 1, 2005
67.498
-1.558
-2.26%
jan 1, 2006
67.115
-0.383
-0.57%
jan 1, 2007
65.757
-1.358
-2.02%
jan 1, 2008
64.745
-1.012
-1.54%
jan 1, 2009
64.238
-0.508
-0.78%
jan 1, 2010
62.976
-1.262
-1.96%
jan 1, 2011
62.211
-0.764
-1.21%
jan 1, 2012
62.122
-0.09
-0.14%
jan 1, 2013
62.666
+0.545
0.88%
Ranking of countries by current statistics by years


Comments: