29
/
en
AIzaSyAYiBZKx7MnpbEhh9jyipgxe19OcubqV5w
April 1, 2024
228805
Romania
ROU
true
2
1
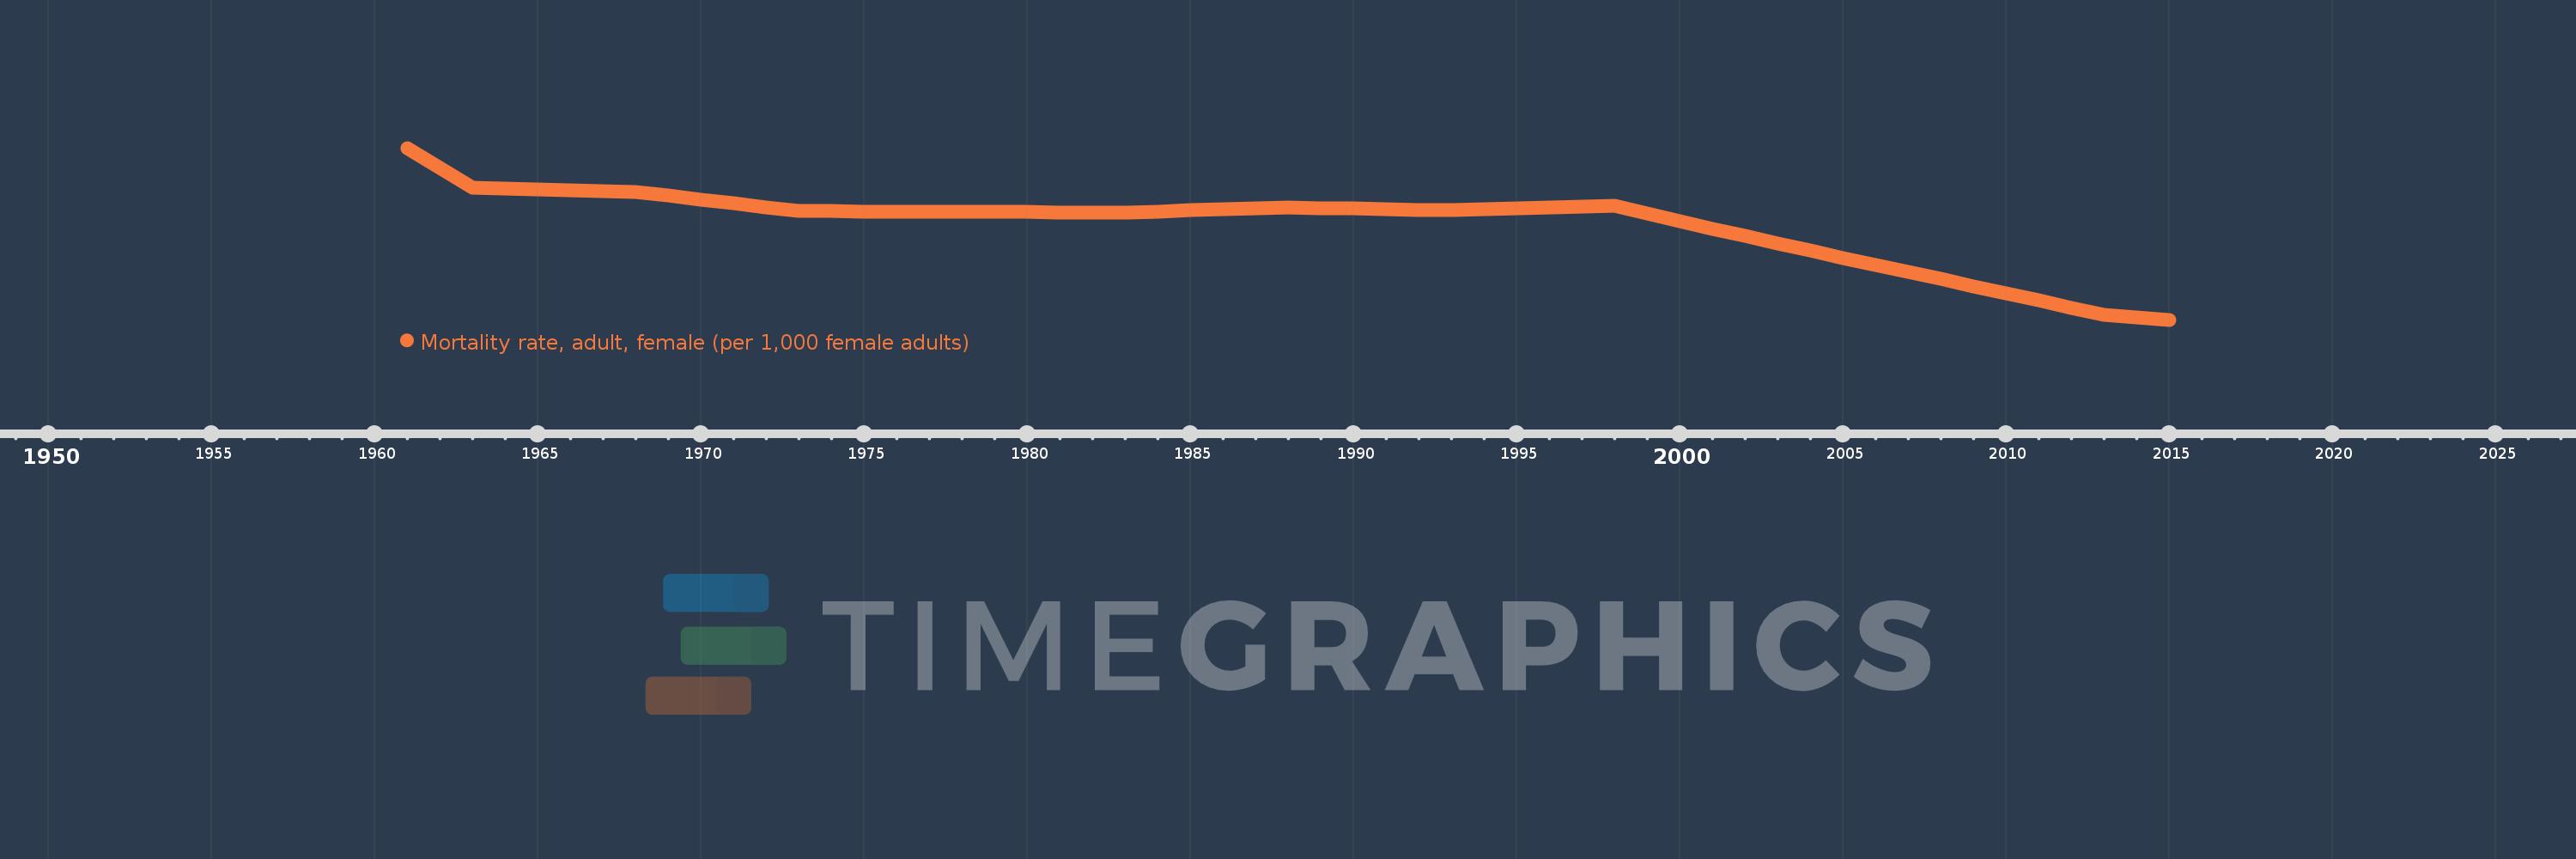
Mortality rate, adult, female (per 1,000 female adults)
2015,2014,2013,2012,2011,2010,2009,2008,2007,2006,2005,2004,2003,2002,2001,2000,1999,1998,1997,1996,1995,1994,1993,1992,1991,1990,1989,1988,1987,1986,1985,1984,1983,1982,1981,1980,1979,1978,1977,1976,1975,1974,1973,1972,1971,1970,1969,1968,1967,1966,1965,1964,1963,1962,1961
This statistics in other country:
AfghanistanAlbaniaAlgeriaAngolaAntigua and BarbudaArab WorldArgentinaArmeniaArubaAustraliaAustriaAzerbaijanBahamas, TheBahrainBangladeshBarbadosBelarusBelgiumBelizeBeninBhutanBoliviaBosnia and HerzegovinaBotswanaBrazilBrunei DarussalamBulgariaBurkina FasoBurundiCabo VerdeCambodiaCameroonCanadaCaribbean small statesCentral African RepublicCentral Europe and the BalticsChadChannel IslandsChileChinaColombiaComorosCongo, Dem. Rep.Congo, Rep.Costa RicaCote d'IvoireCroatiaCubaCuracaoCyprusCzech RepublicDenmarkDjiboutiDominicaDominican RepublicEarly-demographic dividendEast Asia & PacificEast Asia & Pacific (excluding high income)East Asia & Pacific (IDA & IBRD countries)EcuadorEgypt, Arab Rep.El SalvadorEquatorial GuineaEritreaEstoniaEthiopiaEuro areaEurope & Central AsiaEurope & Central Asia (excluding high income)Europe & Central Asia (IDA & IBRD countries)European UnionFijiFinlandFragile and conflict affected situationsFranceFrench PolynesiaGabonGambia, TheGeorgiaGermanyGhanaGreeceGreenlandGrenadaGuamGuatemalaGuineaGuinea-BissauGuyanaHaitiHeavily indebted poor countries (HIPC)High incomeHondurasHong Kong SAR, ChinaHungaryIBRD onlyIcelandIDA & IBRD totalIDA blendIDA onlyIDA totalIndiaIndonesiaIran, Islamic Rep.IraqIrelandIsraelItalyJamaicaJapanJordanKazakhstanKenyaKiribatiKorea, Dem. People’s Rep.Korea, Rep.KuwaitKyrgyz RepublicLao PDRLate-demographic dividendLatin America & Caribbean Latin America & Caribbean (excluding high income)Latin America & the Caribbean (IDA & IBRD countries)LatviaLeast developed countries: UN classificationLebanonLesothoLiberiaLibyaLithuaniaLow & middle incomeLow incomeLower middle incomeLuxembourgMacao SAR, ChinaMacedonia, FYRMadagascarMalawiMalaysiaMaldivesMaliMaltaMarshall IslandsMauritaniaMauritiusMexicoMicronesia, Fed. Sts.Middle East & North AfricaMiddle East & North Africa (excluding high income)Middle East & North Africa (IDA & IBRD countries)Middle incomeMoldovaMongoliaMontenegroMoroccoMozambiqueMyanmarNamibiaNepalNetherlandsNew CaledoniaNew ZealandNicaraguaNigerNigeriaNorth AmericaNorwayOECD membersOmanOther small statesPacific island small statesPakistanPanamaPapua New GuineaParaguayPeruPhilippinesPolandPortugalPost-demographic dividendPre-demographic dividendPuerto RicoQatarRomaniaRussian FederationRwandaSamoaSao Tome and PrincipeSaudi ArabiaSenegalSerbiaSeychellesSierra LeoneSingaporeSlovak RepublicSloveniaSmall statesSolomon IslandsSomaliaSouth AfricaSouth AsiaSouth Asia (IDA & IBRD)South SudanSpainSri LankaSt. Kitts and NevisSt. LuciaSt. Vincent and the GrenadinesSub-Saharan Africa Sub-Saharan Africa (excluding high income)Sub-Saharan Africa (IDA & IBRD countries)SudanSurinameSwazilandSwedenSwitzerlandSyrian Arab RepublicTajikistanTanzaniaThailandTimor-LesteTogoTongaTrinidad and TobagoTunisiaTurkeyTurkmenistanUgandaUkraineUnited Arab EmiratesUnited KingdomUnited StatesUpper middle incomeUruguayUzbekistanVanuatuVenezuela, RBVietnamVirgin Islands (U.S.)West Bank and GazaWorldYemen, Rep.ZambiaZimbabwe Timeline:
This timeline shows a graph from 1961 to 2015 of Romania. No data until 1960. Number of actual observations by date: 55.
Source name:
World Development Indicators
Source organization:
(1) United Nations Population Division. World Population Prospects. New York, United Nations, Department of Economic and Social Affairs (advanced Excel tables). Available at http://esa.un.org/wpp/unpp/panel_population.htm, (2) University of California, Berkeley, and Max Planck Institute for Demographic Research. Human Mortality Database. [ www.mortality.org or www.humanmortality.de].
Categories, topics:
Health, Gender
Last updated:
apr 23, 2017
Indicators value changes by year
Minimum:
78.567
jan 1, 2015
At the date of observation
Value
Absolute change
Change from previous value
jan 1, 1961
138.2
+138.2
0.0%
jan 1, 1962
131.29
-6.91
-5.0%
jan 1, 1963
124.379
-6.911
-5.26%
jan 1, 1964
124.095
-0.284
-0.23%
jan 1, 1965
123.81
-0.285
-0.23%
jan 1, 1966
123.526
-0.284
-0.23%
jan 1, 1967
123.241
-0.285
-0.23%
jan 1, 1968
122.957
-0.284
-0.23%
jan 1, 1969
121.621
-1.336
-1.09%
jan 1, 1970
120.284
-1.337
-1.1%
jan 1, 1971
118.948
-1.336
-1.11%
jan 1, 1972
117.612
-1.336
-1.12%
jan 1, 1973
116.276
-1.336
-1.14%
jan 1, 1974
116.212
-0.064
-0.06%
jan 1, 1975
116.149
-0.063
-0.05%
jan 1, 1976
116.086
-0.063
-0.05%
jan 1, 1977
116.023
-0.063
-0.05%
jan 1, 1978
115.96
-0.063
-0.05%
jan 1, 1979
115.929
-0.031
-0.03%
jan 1, 1980
115.898
-0.031
-0.03%
jan 1, 1981
115.868
-0.03
-0.03%
jan 1, 1982
115.837
-0.031
-0.03%
jan 1, 1983
115.806
-0.031
-0.03%
jan 1, 1984
116.163
+0.357
0.31%
jan 1, 1985
116.519
+0.356
0.31%
jan 1, 1986
116.876
+0.357
0.31%
jan 1, 1987
117.232
+0.356
0.3%
jan 1, 1988
117.589
+0.357
0.3%
jan 1, 1989
117.372
-0.217
-0.18%
jan 1, 1990
117.155
-0.217
-0.18%
jan 1, 1991
116.938
-0.217
-0.19%
jan 1, 1992
116.721
-0.217
-0.19%
jan 1, 1993
116.504
-0.217
-0.19%
jan 1, 1994
116.822
+0.318
0.27%
jan 1, 1995
117.139
+0.317
0.27%
jan 1, 1996
117.457
+0.318
0.27%
jan 1, 1997
117.774
+0.317
0.27%
jan 1, 1998
118.092
+0.318
0.27%
jan 1, 1999
115.471
-2.621
-2.22%
jan 1, 2000
112.85
-2.621
-2.27%
jan 1, 2001
110.229
-2.621
-2.32%
jan 1, 2002
107.608
-2.621
-2.38%
jan 1, 2003
104.987
-2.621
-2.44%
jan 1, 2004
102.524
-2.463
-2.35%
jan 1, 2005
100.061
-2.463
-2.4%
jan 1, 2006
97.598
-2.463
-2.46%
jan 1, 2007
95.134
-2.464
-2.52%
jan 1, 2008
92.671
-2.463
-2.59%
jan 1, 2009
90.179
-2.492
-2.69%
jan 1, 2010
87.687
-2.492
-2.76%
jan 1, 2011
85.195
-2.492
-2.84%
jan 1, 2012
82.703
-2.492
-2.93%
jan 1, 2013
80.21
-2.493
-3.01%
jan 1, 2014
79.389
-0.821
-1.02%
jan 1, 2015
78.567
-0.822
-1.04%
Ranking of countries by current statistics by years


Comments: