29
/
en
AIzaSyAYiBZKx7MnpbEhh9jyipgxe19OcubqV5w
April 1, 2024
145965
Guinea
GIN
true
2
1
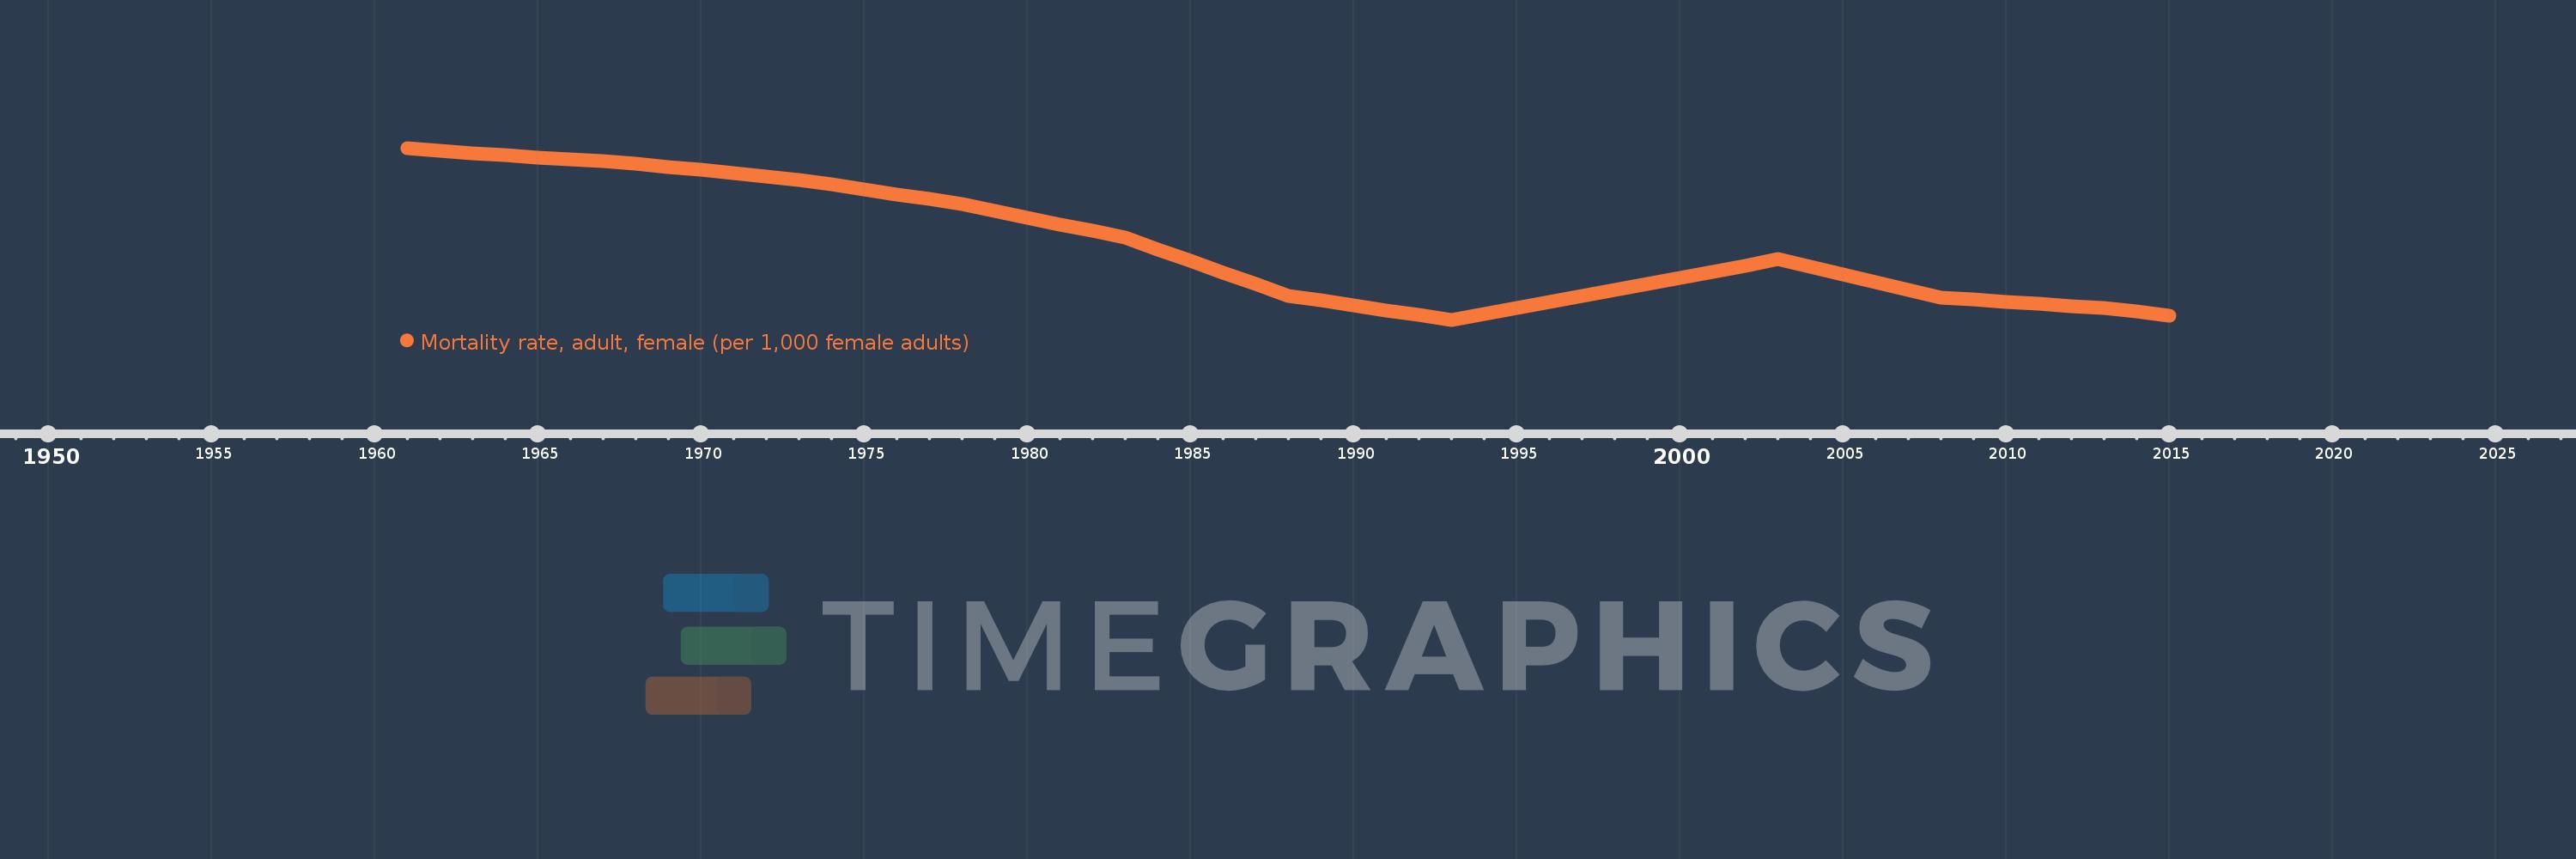
Mortality rate, adult, female (per 1,000 female adults)
2015,2014,2013,2012,2011,2010,2009,2008,2007,2006,2005,2004,2003,2002,2001,2000,1999,1998,1997,1996,1995,1994,1993,1992,1991,1990,1989,1988,1987,1986,1985,1984,1983,1982,1981,1980,1979,1978,1977,1976,1975,1974,1973,1972,1971,1970,1969,1968,1967,1966,1965,1964,1963,1962,1961
This statistics in other country:
AfghanistanAlbaniaAlgeriaAngolaAntigua and BarbudaArab WorldArgentinaArmeniaArubaAustraliaAustriaAzerbaijanBahamas, TheBahrainBangladeshBarbadosBelarusBelgiumBelizeBeninBhutanBoliviaBosnia and HerzegovinaBotswanaBrazilBrunei DarussalamBulgariaBurkina FasoBurundiCabo VerdeCambodiaCameroonCanadaCaribbean small statesCentral African RepublicCentral Europe and the BalticsChadChannel IslandsChileChinaColombiaComorosCongo, Dem. Rep.Congo, Rep.Costa RicaCote d'IvoireCroatiaCubaCuracaoCyprusCzech RepublicDenmarkDjiboutiDominicaDominican RepublicEarly-demographic dividendEast Asia & PacificEast Asia & Pacific (excluding high income)East Asia & Pacific (IDA & IBRD countries)EcuadorEgypt, Arab Rep.El SalvadorEquatorial GuineaEritreaEstoniaEthiopiaEuro areaEurope & Central AsiaEurope & Central Asia (excluding high income)Europe & Central Asia (IDA & IBRD countries)European UnionFijiFinlandFragile and conflict affected situationsFranceFrench PolynesiaGabonGambia, TheGeorgiaGermanyGhanaGreeceGreenlandGrenadaGuamGuatemalaGuineaGuinea-BissauGuyanaHaitiHeavily indebted poor countries (HIPC)High incomeHondurasHong Kong SAR, ChinaHungaryIBRD onlyIcelandIDA & IBRD totalIDA blendIDA onlyIDA totalIndiaIndonesiaIran, Islamic Rep.IraqIrelandIsraelItalyJamaicaJapanJordanKazakhstanKenyaKiribatiKorea, Dem. People’s Rep.Korea, Rep.KuwaitKyrgyz RepublicLao PDRLate-demographic dividendLatin America & Caribbean Latin America & Caribbean (excluding high income)Latin America & the Caribbean (IDA & IBRD countries)LatviaLeast developed countries: UN classificationLebanonLesothoLiberiaLibyaLithuaniaLow & middle incomeLow incomeLower middle incomeLuxembourgMacao SAR, ChinaMacedonia, FYRMadagascarMalawiMalaysiaMaldivesMaliMaltaMarshall IslandsMauritaniaMauritiusMexicoMicronesia, Fed. Sts.Middle East & North AfricaMiddle East & North Africa (excluding high income)Middle East & North Africa (IDA & IBRD countries)Middle incomeMoldovaMongoliaMontenegroMoroccoMozambiqueMyanmarNamibiaNepalNetherlandsNew CaledoniaNew ZealandNicaraguaNigerNigeriaNorth AmericaNorwayOECD membersOmanOther small statesPacific island small statesPakistanPanamaPapua New GuineaParaguayPeruPhilippinesPolandPortugalPost-demographic dividendPre-demographic dividendPuerto RicoQatarRomaniaRussian FederationRwandaSamoaSao Tome and PrincipeSaudi ArabiaSenegalSerbiaSeychellesSierra LeoneSingaporeSlovak RepublicSloveniaSmall statesSolomon IslandsSomaliaSouth AfricaSouth AsiaSouth Asia (IDA & IBRD)South SudanSpainSri LankaSt. Kitts and NevisSt. LuciaSt. Vincent and the GrenadinesSub-Saharan Africa Sub-Saharan Africa (excluding high income)Sub-Saharan Africa (IDA & IBRD countries)SudanSurinameSwazilandSwedenSwitzerlandSyrian Arab RepublicTajikistanTanzaniaThailandTimor-LesteTogoTongaTrinidad and TobagoTunisiaTurkeyTurkmenistanUgandaUkraineUnited Arab EmiratesUnited KingdomUnited StatesUpper middle incomeUruguayUzbekistanVanuatuVenezuela, RBVietnamVirgin Islands (U.S.)West Bank and GazaWorldYemen, Rep.ZambiaZimbabwe Timeline:
This timeline shows a graph from 1961 to 2015 of Guinea. No data until 1960. Number of actual observations by date: 55.
Source name:
World Development Indicators
Source organization:
(1) United Nations Population Division. World Population Prospects. New York, United Nations, Department of Economic and Social Affairs (advanced Excel tables). Available at http://esa.un.org/wpp/unpp/panel_population.htm, (2) University of California, Berkeley, and Max Planck Institute for Demographic Research. Human Mortality Database. [ www.mortality.org or www.humanmortality.de].
Categories, topics:
Health, Gender
Last updated:
apr 23, 2017
Indicators value changes by year
Minimum:
254.756
jan 1, 1993
Maximum:
475.304
jan 1, 1961
At the date of observation
Value
Absolute change
Change from previous value
jan 1, 1961
475.304
+475.304
0.0%
jan 1, 1962
471.974
-3.33
-0.7%
jan 1, 1963
468.645
-3.329
-0.71%
jan 1, 1964
465.973
-2.672
-0.57%
jan 1, 1965
463.3
-2.673
-0.57%
jan 1, 1966
460.628
-2.672
-0.58%
jan 1, 1967
457.956
-2.672
-0.58%
jan 1, 1968
455.283
-2.673
-0.58%
jan 1, 1969
451.109
-4.174
-0.92%
jan 1, 1970
446.935
-4.174
-0.93%
jan 1, 1971
442.761
-4.174
-0.93%
jan 1, 1972
438.587
-4.174
-0.94%
jan 1, 1973
434.413
-4.174
-0.95%
jan 1, 1974
428.214
-6.199
-1.43%
jan 1, 1975
422.015
-6.199
-1.45%
jan 1, 1976
415.817
-6.198
-1.47%
jan 1, 1977
409.618
-6.199
-1.49%
jan 1, 1978
403.42
-6.198
-1.51%
jan 1, 1979
394.726
-8.694
-2.16%
jan 1, 1980
386.032
-8.694
-2.2%
jan 1, 1981
377.338
-8.694
-2.25%
jan 1, 1982
368.644
-8.694
-2.3%
jan 1, 1983
359.95
-8.694
-2.36%
jan 1, 1984
345.037
-14.913
-4.14%
jan 1, 1985
330.123
-14.914
-4.32%
jan 1, 1986
315.209
-14.914
-4.52%
jan 1, 1987
300.295
-14.914
-4.73%
jan 1, 1988
285.382
-14.913
-4.97%
jan 1, 1989
279.257
-6.125
-2.15%
jan 1, 1990
273.131
-6.126
-2.19%
jan 1, 1991
267.006
-6.125
-2.24%
jan 1, 1992
260.881
-6.125
-2.29%
jan 1, 1993
254.756
-6.125
-2.35%
jan 1, 1994
262.305
+7.549
2.96%
jan 1, 1995
269.853
+7.548
2.88%
jan 1, 1996
277.402
+7.549
2.8%
jan 1, 1997
284.95
+7.548
2.72%
jan 1, 1998
292.499
+7.549
2.65%
jan 1, 1999
300.444
+7.945
2.72%
jan 1, 2000
308.39
+7.946
2.64%
jan 1, 2001
316.336
+7.946
2.58%
jan 1, 2002
324.282
+7.946
2.51%
jan 1, 2003
332.228
+7.946
2.45%
jan 1, 2004
322.433
-9.795
-2.95%
jan 1, 2005
312.639
-9.794
-3.04%
jan 1, 2006
302.844
-9.795
-3.13%
jan 1, 2007
293.049
-9.795
-3.23%
jan 1, 2008
283.255
-9.794
-3.34%
jan 1, 2009
280.57
-2.685
-0.95%
jan 1, 2010
277.886
-2.684
-0.96%
jan 1, 2011
275.201
-2.685
-0.97%
jan 1, 2012
272.517
-2.684
-0.98%
jan 1, 2013
269.832
-2.685
-0.99%
jan 1, 2014
265.16
-4.672
-1.73%
jan 1, 2015
260.487
-4.673
-1.76%
Ranking of countries by current statistics by years


Comments: