29
/
en
AIzaSyAYiBZKx7MnpbEhh9jyipgxe19OcubqV5w
April 1, 2024
31852
Europe & Central Asia (excluding high income)
ECA
false
2
1
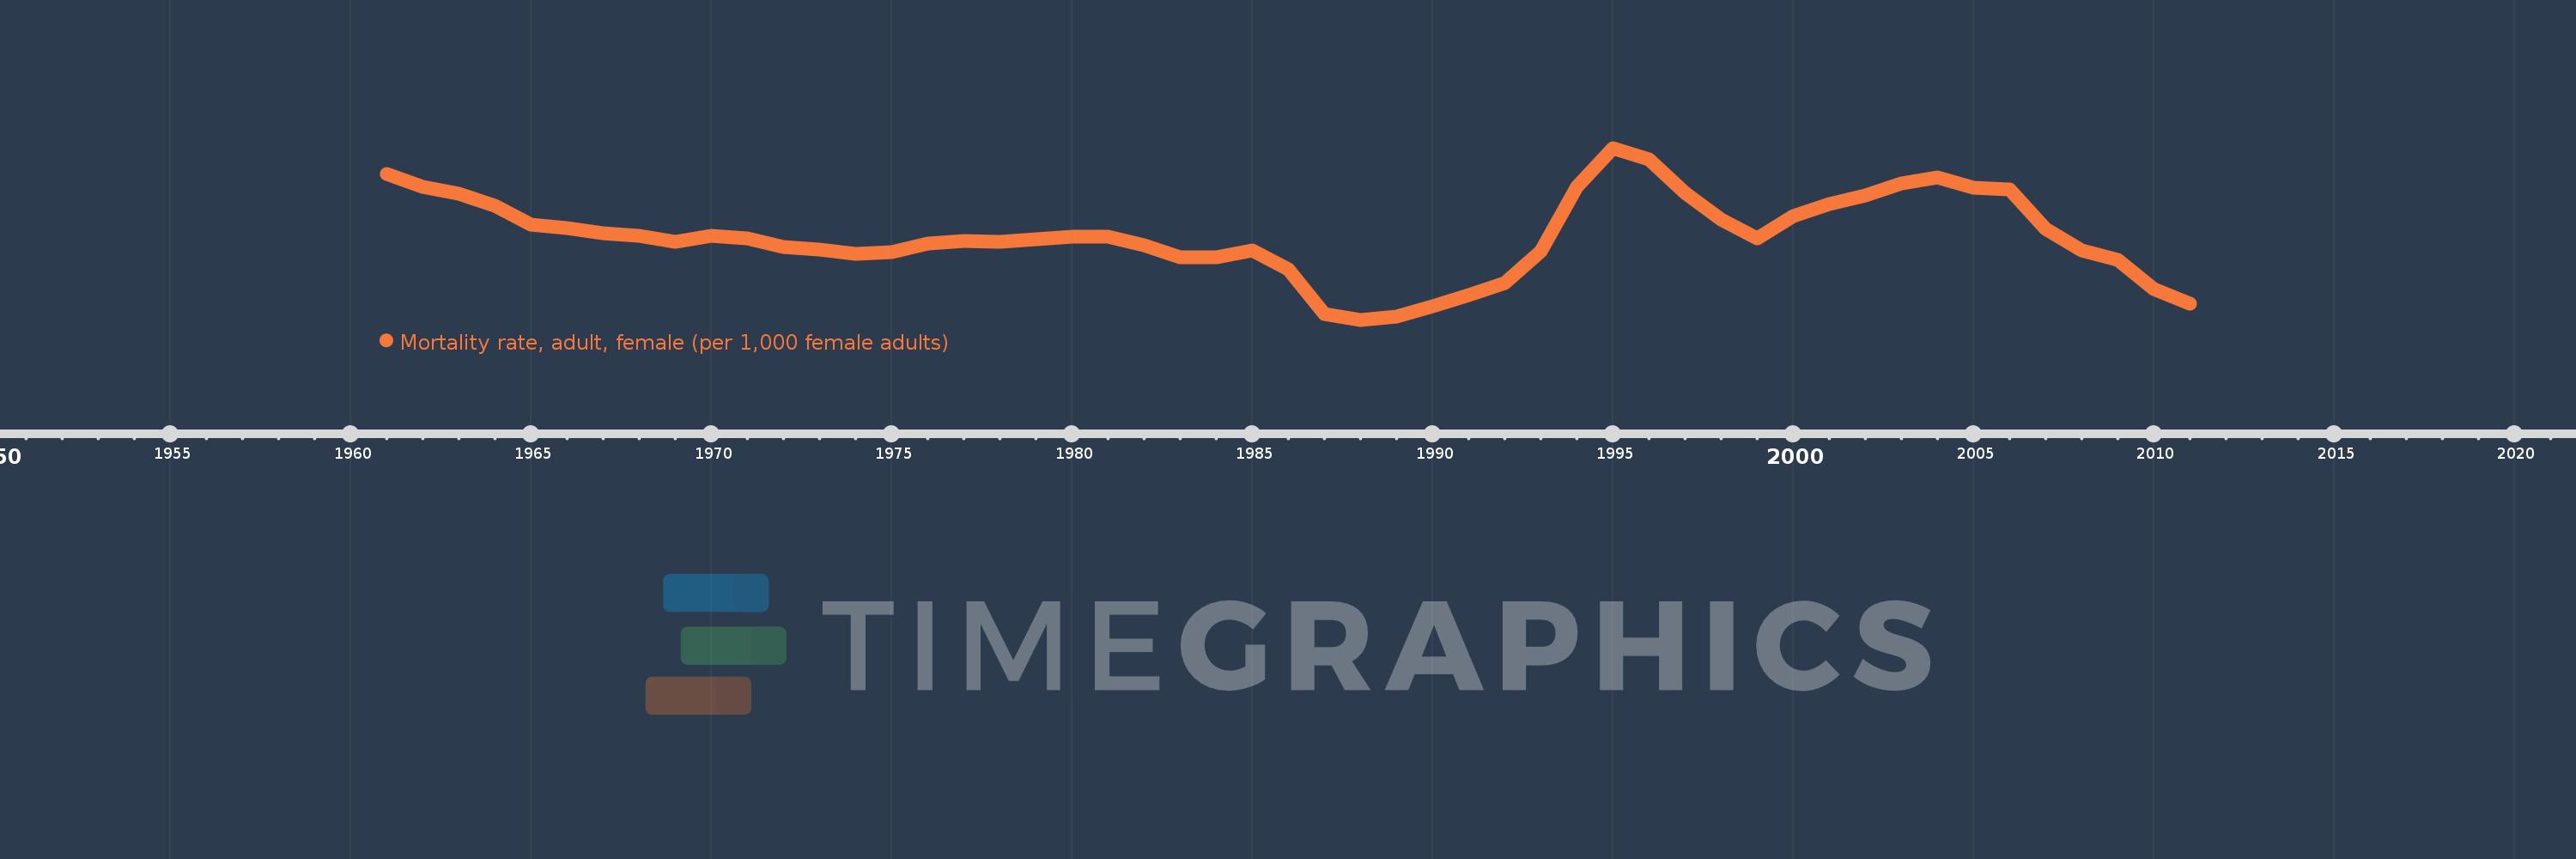
Mortality rate, adult, female (per 1,000 female adults)
2011,2010,2009,2008,2007,2006,2005,2004,2003,2002,2001,2000,1999,1998,1997,1996,1995,1994,1993,1992,1991,1990,1989,1988,1987,1986,1985,1984,1983,1982,1981,1980,1979,1978,1977,1976,1975,1974,1973,1972,1971,1970,1969,1968,1967,1966,1965,1964,1963,1962,1961
This statistics in other country:
AfghanistanAlbaniaAlgeriaAngolaAntigua and BarbudaArab WorldArgentinaArmeniaArubaAustraliaAustriaAzerbaijanBahamas, TheBahrainBangladeshBarbadosBelarusBelgiumBelizeBeninBhutanBoliviaBosnia and HerzegovinaBotswanaBrazilBrunei DarussalamBulgariaBurkina FasoBurundiCabo VerdeCambodiaCameroonCanadaCaribbean small statesCentral African RepublicCentral Europe and the BalticsChadChannel IslandsChileChinaColombiaComorosCongo, Dem. Rep.Congo, Rep.Costa RicaCote d'IvoireCroatiaCubaCuracaoCyprusCzech RepublicDenmarkDjiboutiDominicaDominican RepublicEarly-demographic dividendEast Asia & PacificEast Asia & Pacific (excluding high income)East Asia & Pacific (IDA & IBRD countries)EcuadorEgypt, Arab Rep.El SalvadorEquatorial GuineaEritreaEstoniaEthiopiaEuro areaEurope & Central AsiaEurope & Central Asia (excluding high income)Europe & Central Asia (IDA & IBRD countries)European UnionFijiFinlandFragile and conflict affected situationsFranceFrench PolynesiaGabonGambia, TheGeorgiaGermanyGhanaGreeceGreenlandGrenadaGuamGuatemalaGuineaGuinea-BissauGuyanaHaitiHeavily indebted poor countries (HIPC)High incomeHondurasHong Kong SAR, ChinaHungaryIBRD onlyIcelandIDA & IBRD totalIDA blendIDA onlyIDA totalIndiaIndonesiaIran, Islamic Rep.IraqIrelandIsraelItalyJamaicaJapanJordanKazakhstanKenyaKiribatiKorea, Dem. People’s Rep.Korea, Rep.KuwaitKyrgyz RepublicLao PDRLate-demographic dividendLatin America & Caribbean Latin America & Caribbean (excluding high income)Latin America & the Caribbean (IDA & IBRD countries)LatviaLeast developed countries: UN classificationLebanonLesothoLiberiaLibyaLithuaniaLow & middle incomeLow incomeLower middle incomeLuxembourgMacao SAR, ChinaMacedonia, FYRMadagascarMalawiMalaysiaMaldivesMaliMaltaMarshall IslandsMauritaniaMauritiusMexicoMicronesia, Fed. Sts.Middle East & North AfricaMiddle East & North Africa (excluding high income)Middle East & North Africa (IDA & IBRD countries)Middle incomeMoldovaMongoliaMontenegroMoroccoMozambiqueMyanmarNamibiaNepalNetherlandsNew CaledoniaNew ZealandNicaraguaNigerNigeriaNorth AmericaNorwayOECD membersOmanOther small statesPacific island small statesPakistanPanamaPapua New GuineaParaguayPeruPhilippinesPolandPortugalPost-demographic dividendPre-demographic dividendPuerto RicoQatarRomaniaRussian FederationRwandaSamoaSao Tome and PrincipeSaudi ArabiaSenegalSerbiaSeychellesSierra LeoneSingaporeSlovak RepublicSloveniaSmall statesSolomon IslandsSomaliaSouth AfricaSouth AsiaSouth Asia (IDA & IBRD)South SudanSpainSri LankaSt. Kitts and NevisSt. LuciaSt. Vincent and the GrenadinesSub-Saharan Africa Sub-Saharan Africa (excluding high income)Sub-Saharan Africa (IDA & IBRD countries)SudanSurinameSwazilandSwedenSwitzerlandSyrian Arab RepublicTajikistanTanzaniaThailandTimor-LesteTogoTongaTrinidad and TobagoTunisiaTurkeyTurkmenistanUgandaUkraineUnited Arab EmiratesUnited KingdomUnited StatesUpper middle incomeUruguayUzbekistanVanuatuVenezuela, RBVietnamVirgin Islands (U.S.)West Bank and GazaWorldYemen, Rep.ZambiaZimbabwe Timeline:
This timeline shows a graph from 1961 to 2011 of Europe & Central Asia (excluding high income). No data until 1960. Number of actual observations by date: 51.
Source name:
World Development Indicators
Source organization:
(1) United Nations Population Division. World Population Prospects. New York, United Nations, Department of Economic and Social Affairs (advanced Excel tables). Available at http://esa.un.org/wpp/unpp/panel_population.htm, (2) University of California, Berkeley, and Max Planck Institute for Demographic Research. Human Mortality Database. [ www.mortality.org or www.humanmortality.de].
Categories, topics:
Health, Gender
Last updated:
apr 23, 2017
Indicators value changes by year
Minimum:
112.584
jan 1, 1988
Maximum:
147.202
jan 1, 1995
At the date of observation
Value
Absolute change
Change from previous value
jan 1, 1961
141.998
+141.998
0.0%
jan 1, 1962
139.399
-2.599
-1.83%
jan 1, 1963
137.994
-1.404
-1.01%
jan 1, 1964
135.598
-2.396
-1.74%
jan 1, 1965
131.675
-3.923
-2.89%
jan 1, 1966
131.112
-0.563
-0.43%
jan 1, 1967
129.962
-1.15
-0.88%
jan 1, 1968
129.496
-0.466
-0.36%
jan 1, 1969
128.333
-1.163
-0.9%
jan 1, 1970
129.485
+1.152
0.9%
jan 1, 1971
129.049
-0.437
-0.34%
jan 1, 1972
127.233
-1.816
-1.41%
jan 1, 1973
126.783
-0.45
-0.35%
jan 1, 1974
125.84
-0.942
-0.74%
jan 1, 1975
126.22
+0.379
0.3%
jan 1, 1976
128.0
+1.78
1.41%
jan 1, 1977
128.499
+0.499
0.39%
jan 1, 1978
128.199
-0.3
-0.23%
jan 1, 1979
128.882
+0.683
0.53%
jan 1, 1980
129.332
+0.449
0.35%
jan 1, 1981
129.39
+0.058
0.05%
jan 1, 1982
127.543
-1.846
-1.43%
jan 1, 1983
125.22
-2.323
-1.82%
jan 1, 1984
125.218
-0.003
0.0%
jan 1, 1985
126.509
+1.291
1.03%
jan 1, 1986
122.661
-3.849
-3.04%
jan 1, 1987
113.737
-8.924
-7.28%
jan 1, 1988
112.584
-1.153
-1.01%
jan 1, 1989
113.159
+0.575
0.51%
jan 1, 1990
115.29
+2.131
1.88%
jan 1, 1991
117.535
+2.245
1.95%
jan 1, 1992
120.037
+2.502
2.13%
jan 1, 1993
126.339
+6.302
5.25%
jan 1, 1994
139.385
+13.046
10.33%
jan 1, 1995
147.202
+7.816
5.61%
jan 1, 1996
144.835
-2.367
-1.61%
jan 1, 1997
138.118
-6.716
-4.64%
jan 1, 1998
132.714
-5.405
-3.91%
jan 1, 1999
128.916
-3.798
-2.86%
jan 1, 2000
133.512
+4.596
3.56%
jan 1, 2001
135.973
+2.461
1.84%
jan 1, 2002
137.582
+1.609
1.18%
jan 1, 2003
140.075
+2.493
1.81%
jan 1, 2004
141.335
+1.26
0.9%
jan 1, 2005
139.2
-2.134
-1.51%
jan 1, 2006
138.875
-0.325
-0.23%
jan 1, 2007
130.954
-7.922
-5.7%
jan 1, 2008
126.503
-4.451
-3.4%
jan 1, 2009
124.678
-1.825
-1.44%
jan 1, 2010
118.727
-5.951
-4.77%
jan 1, 2011
115.818
-2.91
-2.45%
Ranking of countries by current statistics by years


Comments: