29
/
en
AIzaSyAYiBZKx7MnpbEhh9jyipgxe19OcubqV5w
April 1, 2024
231352
Rwanda
RWA
true
2
1
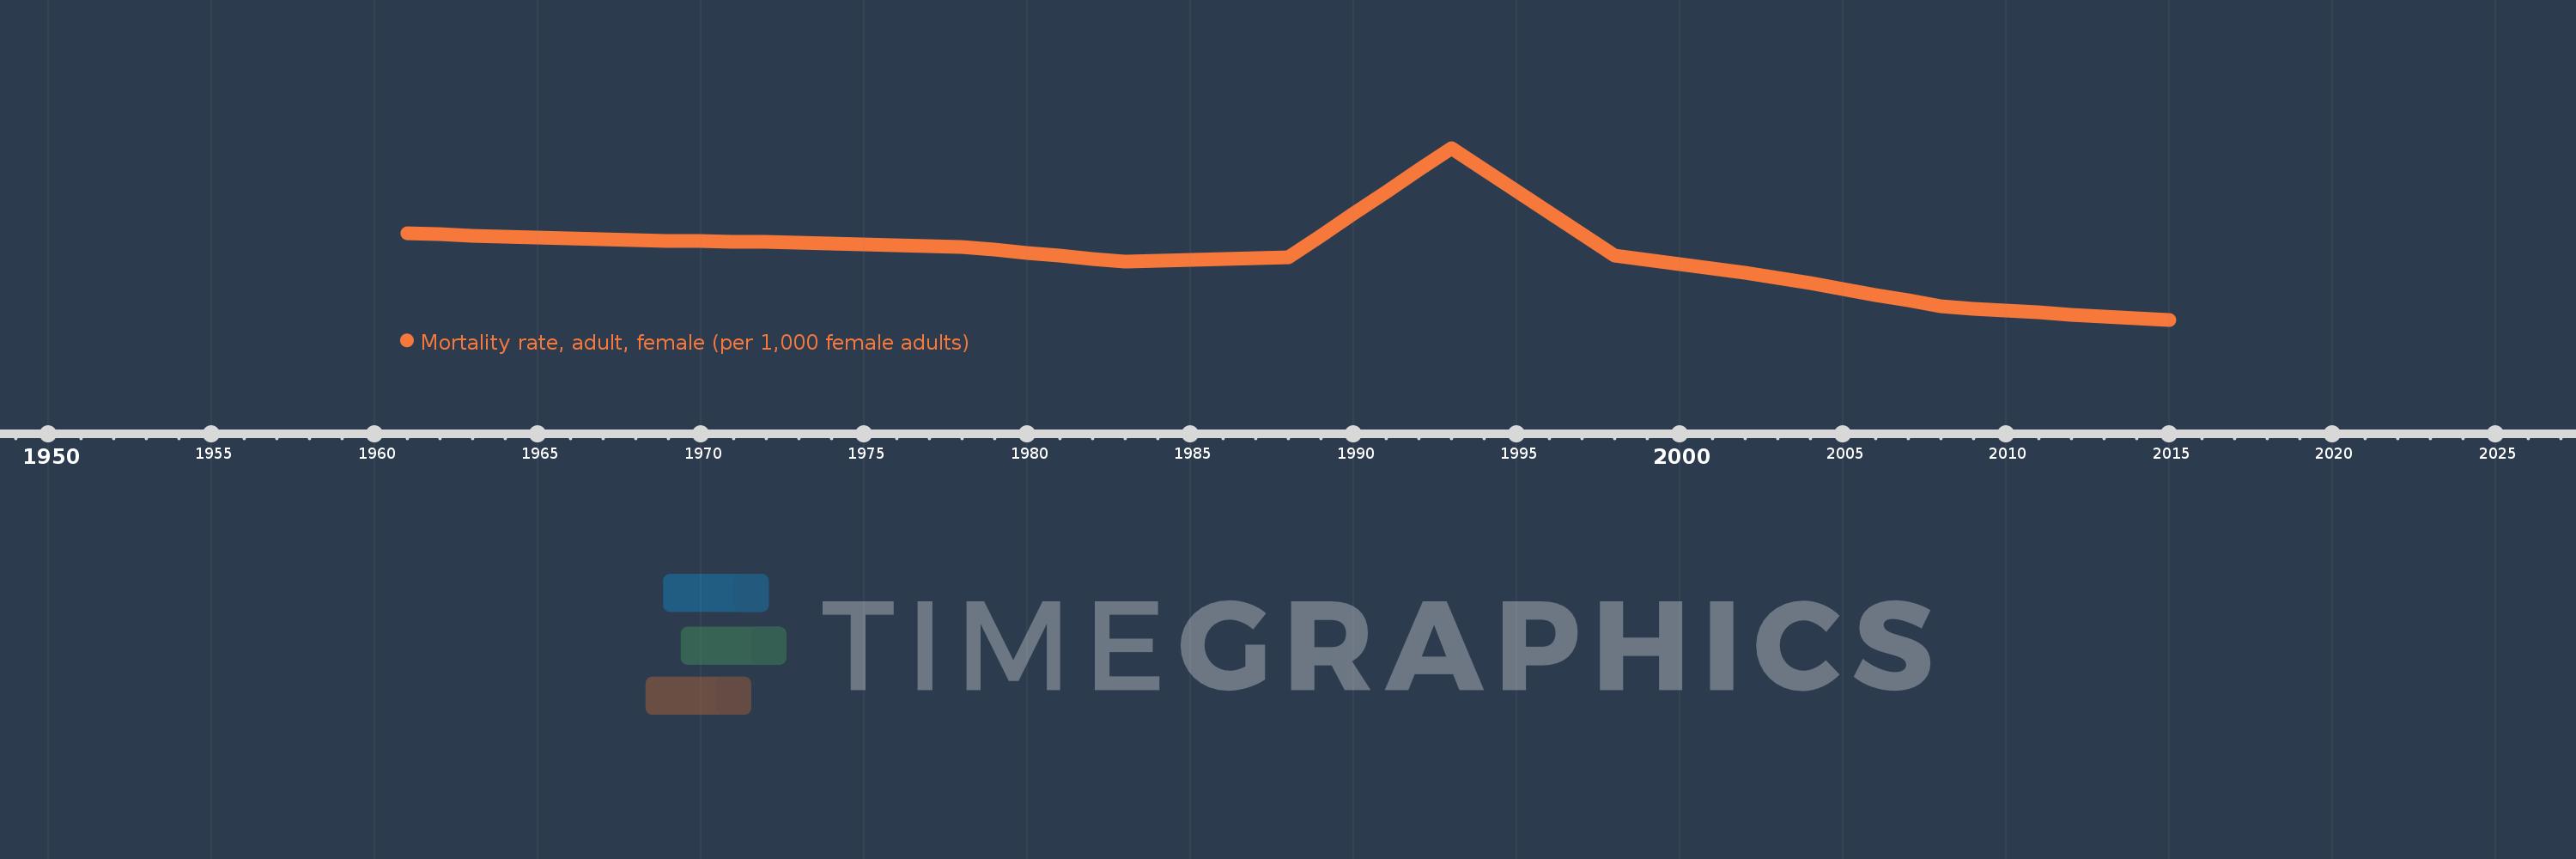
Mortality rate, adult, female (per 1,000 female adults)
2015,2014,2013,2012,2011,2010,2009,2008,2007,2006,2005,2004,2003,2002,2001,2000,1999,1998,1997,1996,1995,1994,1993,1992,1991,1990,1989,1988,1987,1986,1985,1984,1983,1982,1981,1980,1979,1978,1977,1976,1975,1974,1973,1972,1971,1970,1969,1968,1967,1966,1965,1964,1963,1962,1961
This statistics in other country:
AfghanistanAlbaniaAlgeriaAngolaAntigua and BarbudaArab WorldArgentinaArmeniaArubaAustraliaAustriaAzerbaijanBahamas, TheBahrainBangladeshBarbadosBelarusBelgiumBelizeBeninBhutanBoliviaBosnia and HerzegovinaBotswanaBrazilBrunei DarussalamBulgariaBurkina FasoBurundiCabo VerdeCambodiaCameroonCanadaCaribbean small statesCentral African RepublicCentral Europe and the BalticsChadChannel IslandsChileChinaColombiaComorosCongo, Dem. Rep.Congo, Rep.Costa RicaCote d'IvoireCroatiaCubaCuracaoCyprusCzech RepublicDenmarkDjiboutiDominicaDominican RepublicEarly-demographic dividendEast Asia & PacificEast Asia & Pacific (excluding high income)East Asia & Pacific (IDA & IBRD countries)EcuadorEgypt, Arab Rep.El SalvadorEquatorial GuineaEritreaEstoniaEthiopiaEuro areaEurope & Central AsiaEurope & Central Asia (excluding high income)Europe & Central Asia (IDA & IBRD countries)European UnionFijiFinlandFragile and conflict affected situationsFranceFrench PolynesiaGabonGambia, TheGeorgiaGermanyGhanaGreeceGreenlandGrenadaGuamGuatemalaGuineaGuinea-BissauGuyanaHaitiHeavily indebted poor countries (HIPC)High incomeHondurasHong Kong SAR, ChinaHungaryIBRD onlyIcelandIDA & IBRD totalIDA blendIDA onlyIDA totalIndiaIndonesiaIran, Islamic Rep.IraqIrelandIsraelItalyJamaicaJapanJordanKazakhstanKenyaKiribatiKorea, Dem. People’s Rep.Korea, Rep.KuwaitKyrgyz RepublicLao PDRLate-demographic dividendLatin America & Caribbean Latin America & Caribbean (excluding high income)Latin America & the Caribbean (IDA & IBRD countries)LatviaLeast developed countries: UN classificationLebanonLesothoLiberiaLibyaLithuaniaLow & middle incomeLow incomeLower middle incomeLuxembourgMacao SAR, ChinaMacedonia, FYRMadagascarMalawiMalaysiaMaldivesMaliMaltaMarshall IslandsMauritaniaMauritiusMexicoMicronesia, Fed. Sts.Middle East & North AfricaMiddle East & North Africa (excluding high income)Middle East & North Africa (IDA & IBRD countries)Middle incomeMoldovaMongoliaMontenegroMoroccoMozambiqueMyanmarNamibiaNepalNetherlandsNew CaledoniaNew ZealandNicaraguaNigerNigeriaNorth AmericaNorwayOECD membersOmanOther small statesPacific island small statesPakistanPanamaPapua New GuineaParaguayPeruPhilippinesPolandPortugalPost-demographic dividendPre-demographic dividendPuerto RicoQatarRomaniaRussian FederationRwandaSamoaSao Tome and PrincipeSaudi ArabiaSenegalSerbiaSeychellesSierra LeoneSingaporeSlovak RepublicSloveniaSmall statesSolomon IslandsSomaliaSouth AfricaSouth AsiaSouth Asia (IDA & IBRD)South SudanSpainSri LankaSt. Kitts and NevisSt. LuciaSt. Vincent and the GrenadinesSub-Saharan Africa Sub-Saharan Africa (excluding high income)Sub-Saharan Africa (IDA & IBRD countries)SudanSurinameSwazilandSwedenSwitzerlandSyrian Arab RepublicTajikistanTanzaniaThailandTimor-LesteTogoTongaTrinidad and TobagoTunisiaTurkeyTurkmenistanUgandaUkraineUnited Arab EmiratesUnited KingdomUnited StatesUpper middle incomeUruguayUzbekistanVanuatuVenezuela, RBVietnamVirgin Islands (U.S.)West Bank and GazaWorldYemen, Rep.ZambiaZimbabwe Timeline:
This timeline shows a graph from 1961 to 2015 of Rwanda. No data until 1960. Number of actual observations by date: 55.
Source name:
World Development Indicators
Source organization:
(1) United Nations Population Division. World Population Prospects. New York, United Nations, Department of Economic and Social Affairs (advanced Excel tables). Available at http://esa.un.org/wpp/unpp/panel_population.htm, (2) University of California, Berkeley, and Max Planck Institute for Demographic Research. Human Mortality Database. [ www.mortality.org or www.humanmortality.de].
Categories, topics:
Health, Gender
Last updated:
apr 23, 2017
Indicators value changes by year
Minimum:
177.783
jan 1, 2015
Maximum:
613.036
jan 1, 1993
At the date of observation
Value
Absolute change
Change from previous value
jan 1, 1961
397.184
+397.184
0.0%
jan 1, 1962
393.947
-3.237
-0.81%
jan 1, 1963
390.71
-3.237
-0.82%
jan 1, 1964
388.334
-2.376
-0.61%
jan 1, 1965
385.959
-2.375
-0.61%
jan 1, 1966
383.583
-2.376
-0.62%
jan 1, 1967
381.208
-2.375
-0.62%
jan 1, 1968
378.832
-2.376
-0.62%
jan 1, 1969
377.786
-1.046
-0.28%
jan 1, 1970
376.74
-1.046
-0.28%
jan 1, 1971
375.693
-1.047
-0.28%
jan 1, 1972
374.647
-1.046
-0.28%
jan 1, 1973
373.601
-1.046
-0.28%
jan 1, 1974
371.364
-2.237
-0.6%
jan 1, 1975
369.126
-2.238
-0.6%
jan 1, 1976
366.889
-2.237
-0.61%
jan 1, 1977
364.652
-2.237
-0.61%
jan 1, 1978
362.415
-2.237
-0.61%
jan 1, 1979
354.913
-7.502
-2.07%
jan 1, 1980
347.412
-7.501
-2.11%
jan 1, 1981
339.911
-7.501
-2.16%
jan 1, 1982
332.41
-7.501
-2.21%
jan 1, 1983
324.908
-7.502
-2.26%
jan 1, 1984
326.991
+2.083
0.64%
jan 1, 1985
329.073
+2.082
0.64%
jan 1, 1986
331.155
+2.082
0.63%
jan 1, 1987
333.238
+2.083
0.63%
jan 1, 1988
335.32
+2.082
0.62%
jan 1, 1989
390.863
+55.543
16.56%
jan 1, 1990
446.406
+55.543
14.21%
jan 1, 1991
501.949
+55.543
12.44%
jan 1, 1992
557.492
+55.543
11.07%
jan 1, 1993
613.036
+55.544
9.96%
jan 1, 1994
558.437
-54.599
-8.91%
jan 1, 1995
503.839
-54.598
-9.78%
jan 1, 1996
449.241
-54.598
-10.84%
jan 1, 1997
394.643
-54.598
-12.15%
jan 1, 1998
340.045
-54.598
-13.83%
jan 1, 1999
328.983
-11.062
-3.25%
jan 1, 2000
317.922
-11.061
-3.36%
jan 1, 2001
306.86
-11.062
-3.48%
jan 1, 2002
295.799
-11.061
-3.6%
jan 1, 2003
284.737
-11.062
-3.74%
jan 1, 2004
270.124
-14.613
-5.13%
jan 1, 2005
255.511
-14.613
-5.41%
jan 1, 2006
240.897
-14.614
-5.72%
jan 1, 2007
226.284
-14.613
-6.07%
jan 1, 2008
211.67
-14.614
-6.46%
jan 1, 2009
206.367
-5.303
-2.51%
jan 1, 2010
201.063
-5.304
-2.57%
jan 1, 2011
195.759
-5.304
-2.64%
jan 1, 2012
190.455
-5.304
-2.71%
jan 1, 2013
185.152
-5.303
-2.78%
jan 1, 2014
181.467
-3.685
-1.99%
jan 1, 2015
177.783
-3.684
-2.03%
Ranking of countries by current statistics by years


Comments: