29
/
en
AIzaSyAYiBZKx7MnpbEhh9jyipgxe19OcubqV5w
April 1, 2024
123811
Ecuador
ECU
true
2
1
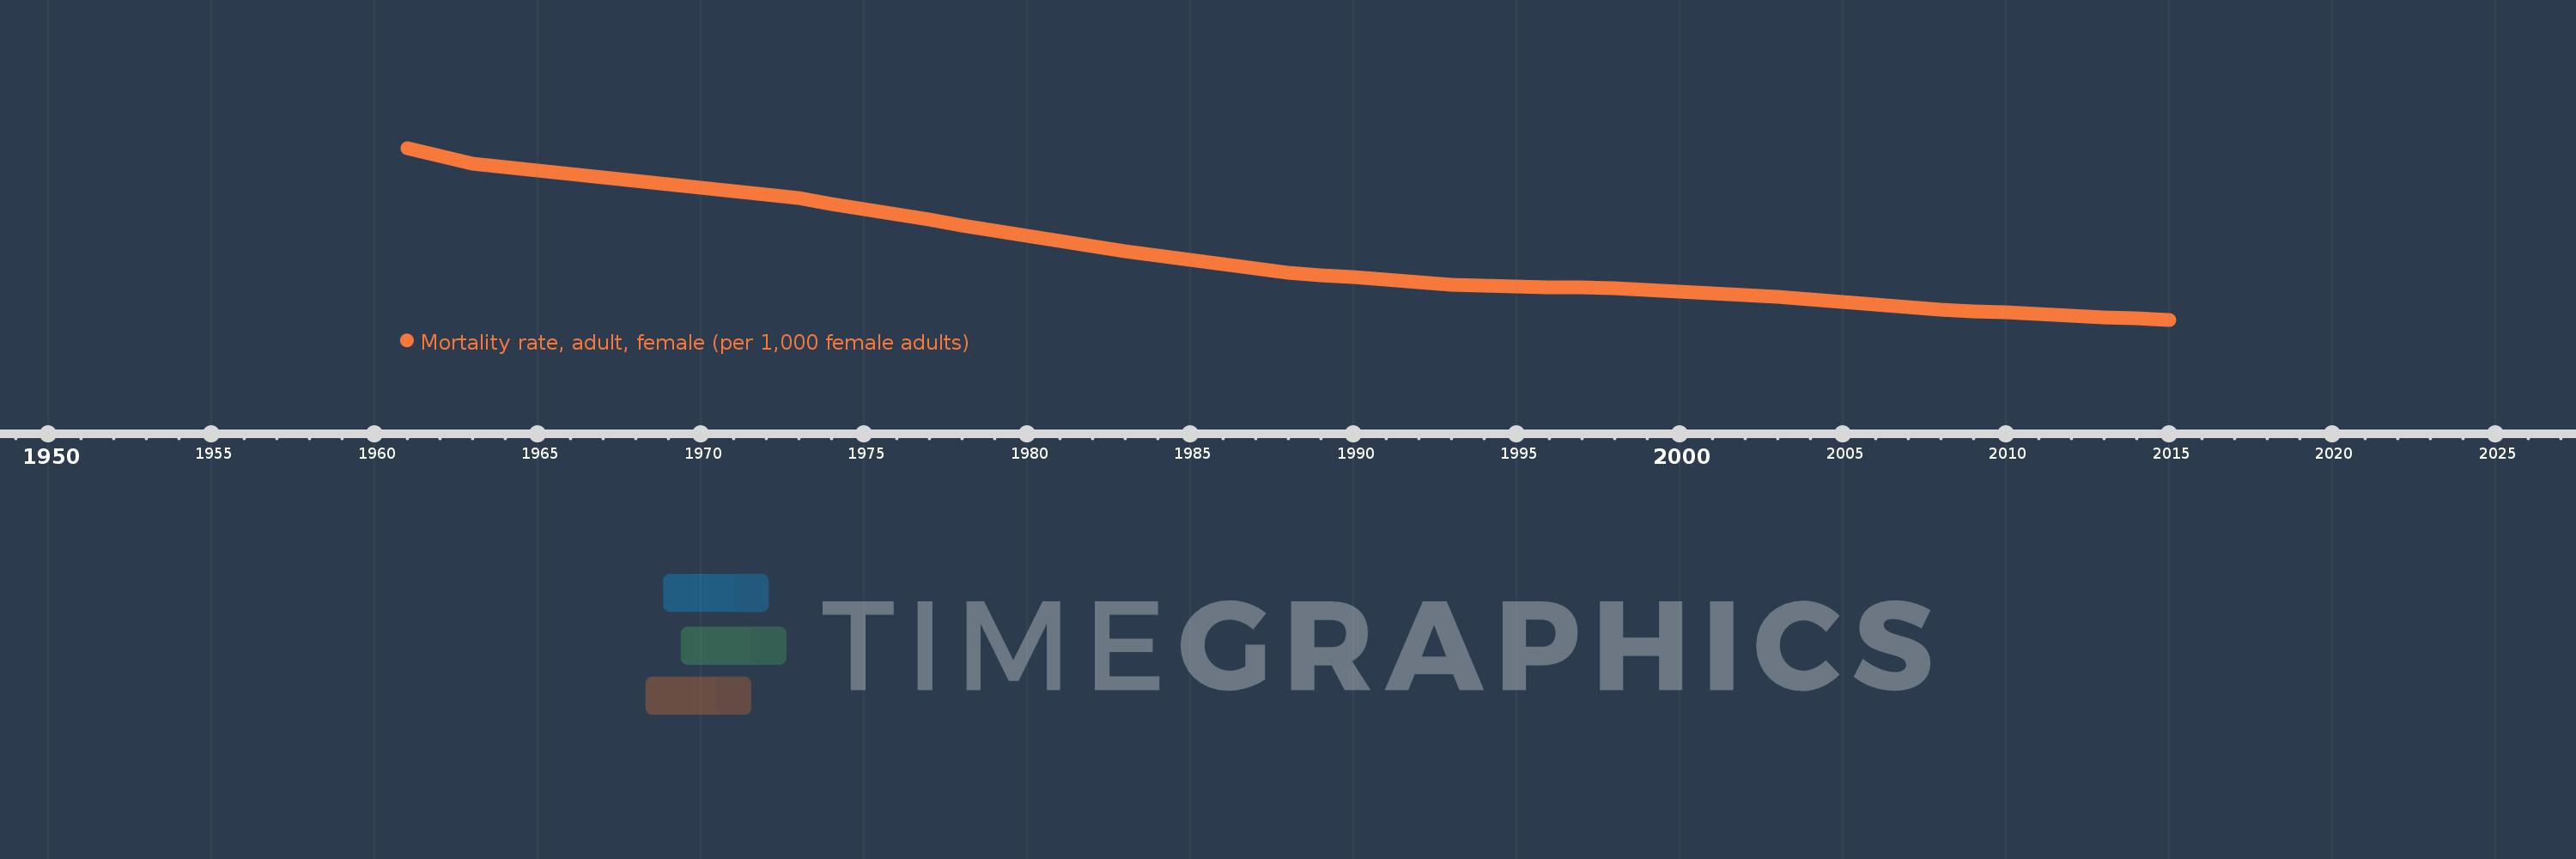
Mortality rate, adult, female (per 1,000 female adults)
2015,2014,2013,2012,2011,2010,2009,2008,2007,2006,2005,2004,2003,2002,2001,2000,1999,1998,1997,1996,1995,1994,1993,1992,1991,1990,1989,1988,1987,1986,1985,1984,1983,1982,1981,1980,1979,1978,1977,1976,1975,1974,1973,1972,1971,1970,1969,1968,1967,1966,1965,1964,1963,1962,1961
This statistics in other country:
AfghanistanAlbaniaAlgeriaAngolaAntigua and BarbudaArab WorldArgentinaArmeniaArubaAustraliaAustriaAzerbaijanBahamas, TheBahrainBangladeshBarbadosBelarusBelgiumBelizeBeninBhutanBoliviaBosnia and HerzegovinaBotswanaBrazilBrunei DarussalamBulgariaBurkina FasoBurundiCabo VerdeCambodiaCameroonCanadaCaribbean small statesCentral African RepublicCentral Europe and the BalticsChadChannel IslandsChileChinaColombiaComorosCongo, Dem. Rep.Congo, Rep.Costa RicaCote d'IvoireCroatiaCubaCuracaoCyprusCzech RepublicDenmarkDjiboutiDominicaDominican RepublicEarly-demographic dividendEast Asia & PacificEast Asia & Pacific (excluding high income)East Asia & Pacific (IDA & IBRD countries)EcuadorEgypt, Arab Rep.El SalvadorEquatorial GuineaEritreaEstoniaEthiopiaEuro areaEurope & Central AsiaEurope & Central Asia (excluding high income)Europe & Central Asia (IDA & IBRD countries)European UnionFijiFinlandFragile and conflict affected situationsFranceFrench PolynesiaGabonGambia, TheGeorgiaGermanyGhanaGreeceGreenlandGrenadaGuamGuatemalaGuineaGuinea-BissauGuyanaHaitiHeavily indebted poor countries (HIPC)High incomeHondurasHong Kong SAR, ChinaHungaryIBRD onlyIcelandIDA & IBRD totalIDA blendIDA onlyIDA totalIndiaIndonesiaIran, Islamic Rep.IraqIrelandIsraelItalyJamaicaJapanJordanKazakhstanKenyaKiribatiKorea, Dem. People’s Rep.Korea, Rep.KuwaitKyrgyz RepublicLao PDRLate-demographic dividendLatin America & Caribbean Latin America & Caribbean (excluding high income)Latin America & the Caribbean (IDA & IBRD countries)LatviaLeast developed countries: UN classificationLebanonLesothoLiberiaLibyaLithuaniaLow & middle incomeLow incomeLower middle incomeLuxembourgMacao SAR, ChinaMacedonia, FYRMadagascarMalawiMalaysiaMaldivesMaliMaltaMarshall IslandsMauritaniaMauritiusMexicoMicronesia, Fed. Sts.Middle East & North AfricaMiddle East & North Africa (excluding high income)Middle East & North Africa (IDA & IBRD countries)Middle incomeMoldovaMongoliaMontenegroMoroccoMozambiqueMyanmarNamibiaNepalNetherlandsNew CaledoniaNew ZealandNicaraguaNigerNigeriaNorth AmericaNorwayOECD membersOmanOther small statesPacific island small statesPakistanPanamaPapua New GuineaParaguayPeruPhilippinesPolandPortugalPost-demographic dividendPre-demographic dividendPuerto RicoQatarRomaniaRussian FederationRwandaSamoaSao Tome and PrincipeSaudi ArabiaSenegalSerbiaSeychellesSierra LeoneSingaporeSlovak RepublicSloveniaSmall statesSolomon IslandsSomaliaSouth AfricaSouth AsiaSouth Asia (IDA & IBRD)South SudanSpainSri LankaSt. Kitts and NevisSt. LuciaSt. Vincent and the GrenadinesSub-Saharan Africa Sub-Saharan Africa (excluding high income)Sub-Saharan Africa (IDA & IBRD countries)SudanSurinameSwazilandSwedenSwitzerlandSyrian Arab RepublicTajikistanTanzaniaThailandTimor-LesteTogoTongaTrinidad and TobagoTunisiaTurkeyTurkmenistanUgandaUkraineUnited Arab EmiratesUnited KingdomUnited StatesUpper middle incomeUruguayUzbekistanVanuatuVenezuela, RBVietnamVirgin Islands (U.S.)West Bank and GazaWorldYemen, Rep.ZambiaZimbabwe Timeline:
This timeline shows a graph from 1961 to 2015 of Ecuador. No data until 1960. Number of actual observations by date: 55.
Source name:
World Development Indicators
Source organization:
(1) United Nations Population Division. World Population Prospects. New York, United Nations, Department of Economic and Social Affairs (advanced Excel tables). Available at http://esa.un.org/wpp/unpp/panel_population.htm, (2) University of California, Berkeley, and Max Planck Institute for Demographic Research. Human Mortality Database. [ www.mortality.org or www.humanmortality.de].
Categories, topics:
Health, Gender
Last updated:
apr 23, 2017
Indicators value changes by year
Minimum:
87.255
jan 1, 2015
Maximum:
270.393
jan 1, 1961
At the date of observation
Value
Absolute change
Change from previous value
jan 1, 1961
270.393
+270.393
0.0%
jan 1, 1962
262.054
-8.339
-3.08%
jan 1, 1963
253.714
-8.34
-3.18%
jan 1, 1964
250.074
-3.64
-1.43%
jan 1, 1965
246.434
-3.64
-1.46%
jan 1, 1966
242.793
-3.641
-1.48%
jan 1, 1967
239.153
-3.64
-1.5%
jan 1, 1968
235.513
-3.64
-1.52%
jan 1, 1969
231.765
-3.748
-1.59%
jan 1, 1970
228.017
-3.748
-1.62%
jan 1, 1971
224.27
-3.747
-1.64%
jan 1, 1972
220.522
-3.748
-1.67%
jan 1, 1973
216.774
-3.748
-1.7%
jan 1, 1974
211.029
-5.745
-2.65%
jan 1, 1975
205.285
-5.744
-2.72%
jan 1, 1976
199.54
-5.745
-2.8%
jan 1, 1977
193.795
-5.745
-2.88%
jan 1, 1978
188.05
-5.745
-2.96%
jan 1, 1979
182.457
-5.593
-2.97%
jan 1, 1980
176.864
-5.593
-3.07%
jan 1, 1981
171.271
-5.593
-3.16%
jan 1, 1982
165.677
-5.594
-3.27%
jan 1, 1983
160.084
-5.593
-3.38%
jan 1, 1984
155.555
-4.529
-2.83%
jan 1, 1985
151.026
-4.529
-2.91%
jan 1, 1986
146.497
-4.529
-3.0%
jan 1, 1987
141.968
-4.529
-3.09%
jan 1, 1988
137.44
-4.528
-3.19%
jan 1, 1989
134.877
-2.563
-1.86%
jan 1, 1990
132.314
-2.563
-1.9%
jan 1, 1991
129.75
-2.564
-1.94%
jan 1, 1992
127.187
-2.563
-1.98%
jan 1, 1993
124.624
-2.563
-2.02%
jan 1, 1994
123.823
-0.801
-0.64%
jan 1, 1995
123.022
-0.801
-0.65%
jan 1, 1996
122.221
-0.801
-0.65%
jan 1, 1997
121.42
-0.801
-0.66%
jan 1, 1998
120.619
-0.801
-0.66%
jan 1, 1999
118.773
-1.846
-1.53%
jan 1, 2000
116.926
-1.847
-1.56%
jan 1, 2001
115.08
-1.846
-1.58%
jan 1, 2002
113.234
-1.846
-1.6%
jan 1, 2003
111.388
-1.846
-1.63%
jan 1, 2004
108.771
-2.617
-2.35%
jan 1, 2005
106.154
-2.617
-2.41%
jan 1, 2006
103.537
-2.617
-2.47%
jan 1, 2007
100.92
-2.617
-2.53%
jan 1, 2008
98.303
-2.617
-2.59%
jan 1, 2009
96.592
-1.711
-1.74%
jan 1, 2010
94.881
-1.711
-1.77%
jan 1, 2011
93.17
-1.711
-1.8%
jan 1, 2012
91.459
-1.711
-1.84%
jan 1, 2013
89.748
-1.711
-1.87%
jan 1, 2014
88.501
-1.247
-1.39%
jan 1, 2015
87.255
-1.246
-1.41%
Ranking of countries by current statistics by years


Comments: