29
/
en
AIzaSyAYiBZKx7MnpbEhh9jyipgxe19OcubqV5w
April 1, 2024
151823
Hong Kong SAR, China
HKG
true
2
1
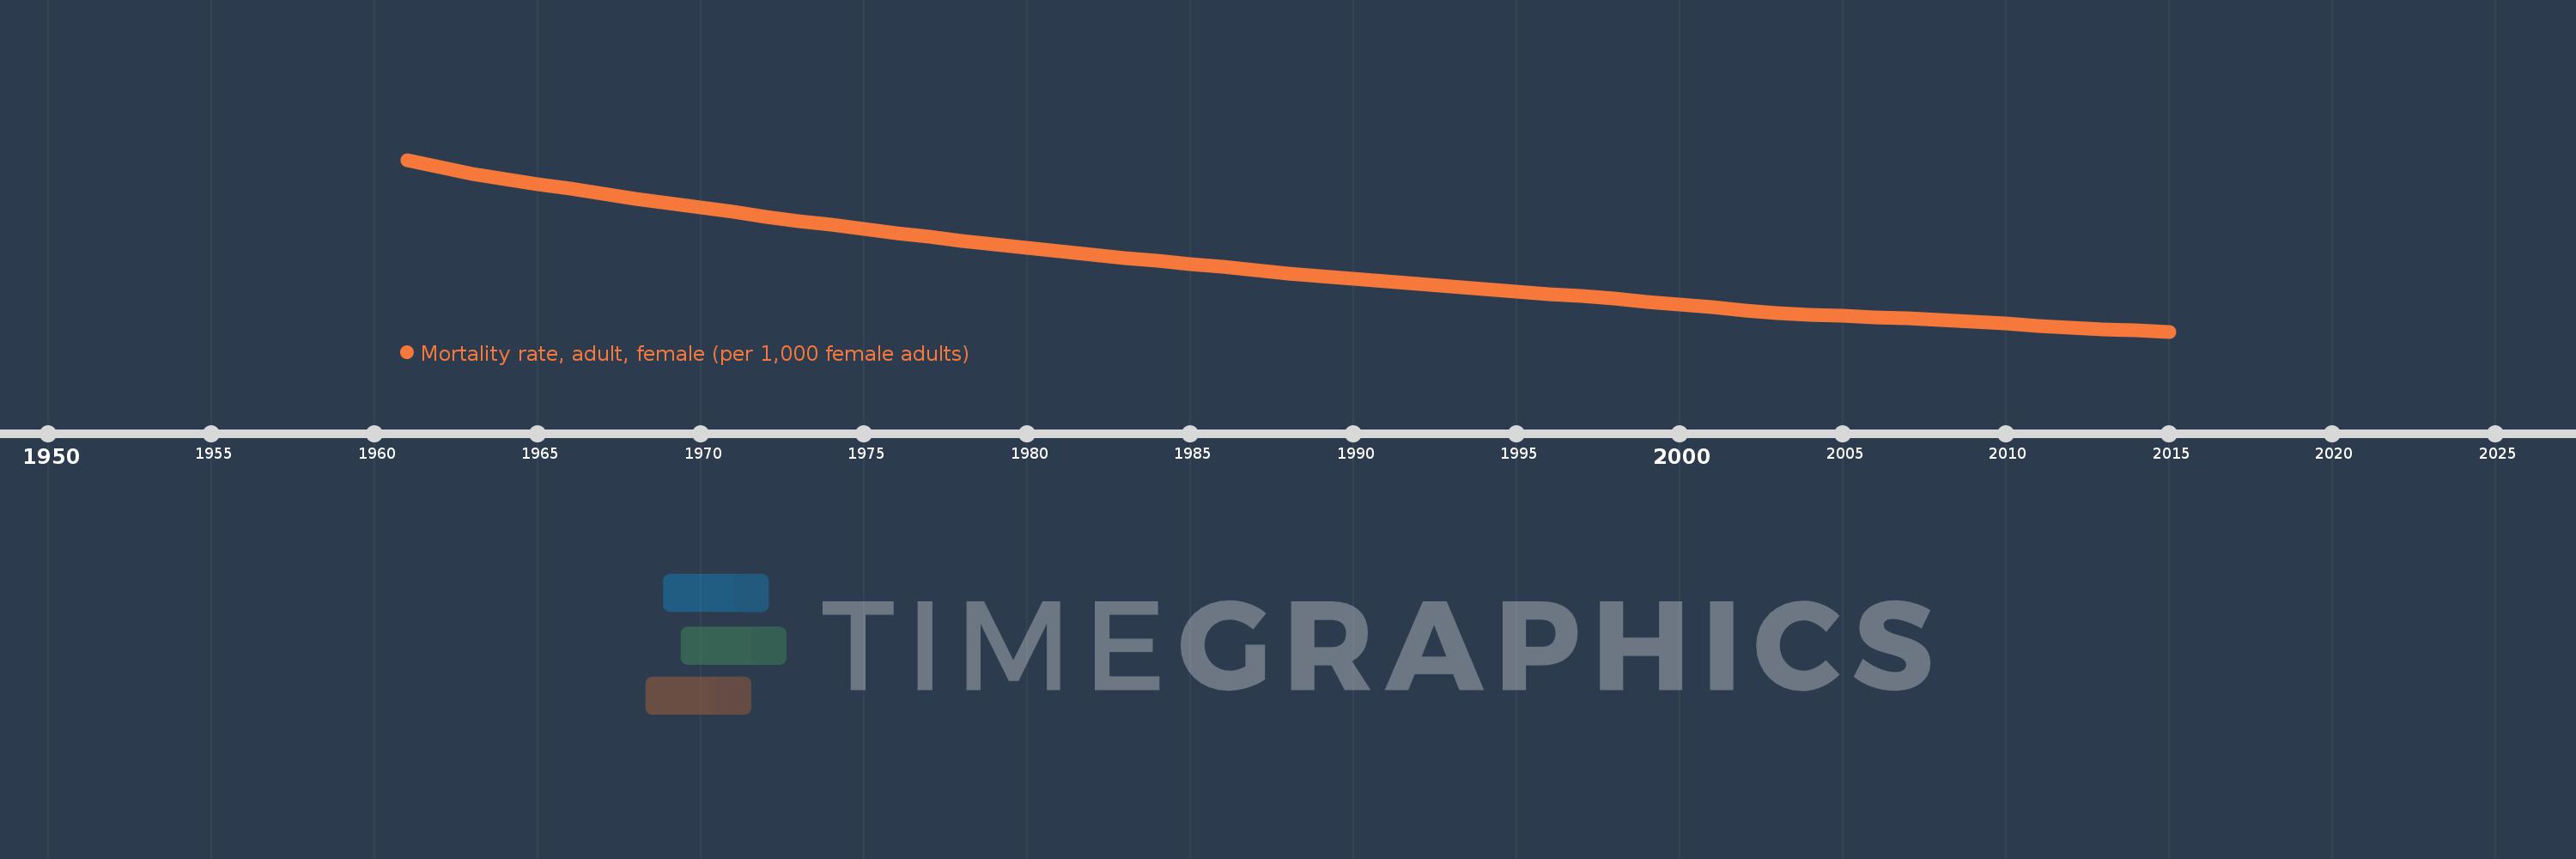
Mortality rate, adult, female (per 1,000 female adults)
2015,2014,2013,2012,2011,2010,2009,2008,2007,2006,2005,2004,2003,2002,2001,2000,1999,1998,1997,1996,1995,1994,1993,1992,1991,1990,1989,1988,1987,1986,1985,1984,1983,1982,1981,1980,1979,1978,1977,1976,1975,1974,1973,1972,1971,1970,1969,1968,1967,1966,1965,1964,1963,1962,1961
This statistics in other country:
AfghanistanAlbaniaAlgeriaAngolaAntigua and BarbudaArab WorldArgentinaArmeniaArubaAustraliaAustriaAzerbaijanBahamas, TheBahrainBangladeshBarbadosBelarusBelgiumBelizeBeninBhutanBoliviaBosnia and HerzegovinaBotswanaBrazilBrunei DarussalamBulgariaBurkina FasoBurundiCabo VerdeCambodiaCameroonCanadaCaribbean small statesCentral African RepublicCentral Europe and the BalticsChadChannel IslandsChileChinaColombiaComorosCongo, Dem. Rep.Congo, Rep.Costa RicaCote d'IvoireCroatiaCubaCuracaoCyprusCzech RepublicDenmarkDjiboutiDominicaDominican RepublicEarly-demographic dividendEast Asia & PacificEast Asia & Pacific (excluding high income)East Asia & Pacific (IDA & IBRD countries)EcuadorEgypt, Arab Rep.El SalvadorEquatorial GuineaEritreaEstoniaEthiopiaEuro areaEurope & Central AsiaEurope & Central Asia (excluding high income)Europe & Central Asia (IDA & IBRD countries)European UnionFijiFinlandFragile and conflict affected situationsFranceFrench PolynesiaGabonGambia, TheGeorgiaGermanyGhanaGreeceGreenlandGrenadaGuamGuatemalaGuineaGuinea-BissauGuyanaHaitiHeavily indebted poor countries (HIPC)High incomeHondurasHong Kong SAR, ChinaHungaryIBRD onlyIcelandIDA & IBRD totalIDA blendIDA onlyIDA totalIndiaIndonesiaIran, Islamic Rep.IraqIrelandIsraelItalyJamaicaJapanJordanKazakhstanKenyaKiribatiKorea, Dem. People’s Rep.Korea, Rep.KuwaitKyrgyz RepublicLao PDRLate-demographic dividendLatin America & Caribbean Latin America & Caribbean (excluding high income)Latin America & the Caribbean (IDA & IBRD countries)LatviaLeast developed countries: UN classificationLebanonLesothoLiberiaLibyaLithuaniaLow & middle incomeLow incomeLower middle incomeLuxembourgMacao SAR, ChinaMacedonia, FYRMadagascarMalawiMalaysiaMaldivesMaliMaltaMarshall IslandsMauritaniaMauritiusMexicoMicronesia, Fed. Sts.Middle East & North AfricaMiddle East & North Africa (excluding high income)Middle East & North Africa (IDA & IBRD countries)Middle incomeMoldovaMongoliaMontenegroMoroccoMozambiqueMyanmarNamibiaNepalNetherlandsNew CaledoniaNew ZealandNicaraguaNigerNigeriaNorth AmericaNorwayOECD membersOmanOther small statesPacific island small statesPakistanPanamaPapua New GuineaParaguayPeruPhilippinesPolandPortugalPost-demographic dividendPre-demographic dividendPuerto RicoQatarRomaniaRussian FederationRwandaSamoaSao Tome and PrincipeSaudi ArabiaSenegalSerbiaSeychellesSierra LeoneSingaporeSlovak RepublicSloveniaSmall statesSolomon IslandsSomaliaSouth AfricaSouth AsiaSouth Asia (IDA & IBRD)South SudanSpainSri LankaSt. Kitts and NevisSt. LuciaSt. Vincent and the GrenadinesSub-Saharan Africa Sub-Saharan Africa (excluding high income)Sub-Saharan Africa (IDA & IBRD countries)SudanSurinameSwazilandSwedenSwitzerlandSyrian Arab RepublicTajikistanTanzaniaThailandTimor-LesteTogoTongaTrinidad and TobagoTunisiaTurkeyTurkmenistanUgandaUkraineUnited Arab EmiratesUnited KingdomUnited StatesUpper middle incomeUruguayUzbekistanVanuatuVenezuela, RBVietnamVirgin Islands (U.S.)West Bank and GazaWorldYemen, Rep.ZambiaZimbabwe Timeline:
This timeline shows a graph from 1961 to 2015 of Hong Kong SAR, China. No data until 1960. Number of actual observations by date: 55.
Source name:
World Development Indicators
Source organization:
(1) United Nations Population Division. World Population Prospects. New York, United Nations, Department of Economic and Social Affairs (advanced Excel tables). Available at http://esa.un.org/wpp/unpp/panel_population.htm, (2) University of California, Berkeley, and Max Planck Institute for Demographic Research. Human Mortality Database. [ www.mortality.org or www.humanmortality.de].
Categories, topics:
Health, Gender
Last updated:
apr 23, 2017
Indicators value changes by year
Minimum:
32.245
jan 1, 2015
Maximum:
138.769
jan 1, 1961
At the date of observation
Value
Absolute change
Change from previous value
jan 1, 1961
138.769
+138.769
0.0%
jan 1, 1962
134.393
-4.376
-3.15%
jan 1, 1963
130.018
-4.375
-3.26%
jan 1, 1964
126.919
-3.099
-2.38%
jan 1, 1965
123.82
-3.099
-2.44%
jan 1, 1966
120.721
-3.099
-2.5%
jan 1, 1967
117.622
-3.099
-2.57%
jan 1, 1968
114.523
-3.099
-2.63%
jan 1, 1969
111.776
-2.747
-2.4%
jan 1, 1970
109.028
-2.748
-2.46%
jan 1, 1971
106.281
-2.747
-2.52%
jan 1, 1972
103.534
-2.747
-2.58%
jan 1, 1973
100.787
-2.747
-2.65%
jan 1, 1974
98.356
-2.431
-2.41%
jan 1, 1975
95.925
-2.431
-2.47%
jan 1, 1976
93.494
-2.431
-2.53%
jan 1, 1977
91.063
-2.431
-2.6%
jan 1, 1978
88.632
-2.431
-2.67%
jan 1, 1979
86.485
-2.147
-2.42%
jan 1, 1980
84.337
-2.148
-2.48%
jan 1, 1981
82.19
-2.147
-2.55%
jan 1, 1982
80.042
-2.148
-2.61%
jan 1, 1983
77.895
-2.147
-2.68%
jan 1, 1984
76.0
-1.895
-2.43%
jan 1, 1985
74.105
-1.895
-2.49%
jan 1, 1986
72.211
-1.894
-2.56%
jan 1, 1987
70.316
-1.895
-2.62%
jan 1, 1988
68.422
-1.894
-2.69%
jan 1, 1989
66.752
-1.67
-2.44%
jan 1, 1990
65.083
-1.669
-2.5%
jan 1, 1991
63.413
-1.67
-2.57%
jan 1, 1992
61.743
-1.67
-2.63%
jan 1, 1993
60.074
-1.669
-2.7%
jan 1, 1994
58.604
-1.47
-2.45%
jan 1, 1995
57.134
-1.47
-2.51%
jan 1, 1996
55.665
-1.469
-2.57%
jan 1, 1997
54.195
-1.47
-2.64%
jan 1, 1998
52.725
-1.47
-2.71%
jan 1, 1999
50.871
-1.854
-3.52%
jan 1, 2000
49.017
-1.854
-3.64%
jan 1, 2001
47.163
-1.854
-3.78%
jan 1, 2002
45.309
-1.854
-3.93%
jan 1, 2003
43.456
-1.853
-4.09%
jan 1, 2004
42.658
-0.798
-1.84%
jan 1, 2005
41.861
-0.797
-1.87%
jan 1, 2006
41.063
-0.798
-1.91%
jan 1, 2007
40.266
-0.797
-1.94%
jan 1, 2008
39.468
-0.798
-1.98%
jan 1, 2009
38.286
-1.182
-2.99%
jan 1, 2010
37.103
-1.183
-3.09%
jan 1, 2011
35.921
-1.182
-3.19%
jan 1, 2012
34.739
-1.182
-3.29%
jan 1, 2013
33.556
-1.183
-3.41%
jan 1, 2014
32.901
-0.655
-1.95%
jan 1, 2015
32.245
-0.656
-1.99%
Ranking of countries by current statistics by years


Comments: