29
/
en
AIzaSyAYiBZKx7MnpbEhh9jyipgxe19OcubqV5w
April 1, 2024
74187
Austria
AUT
true
2
1
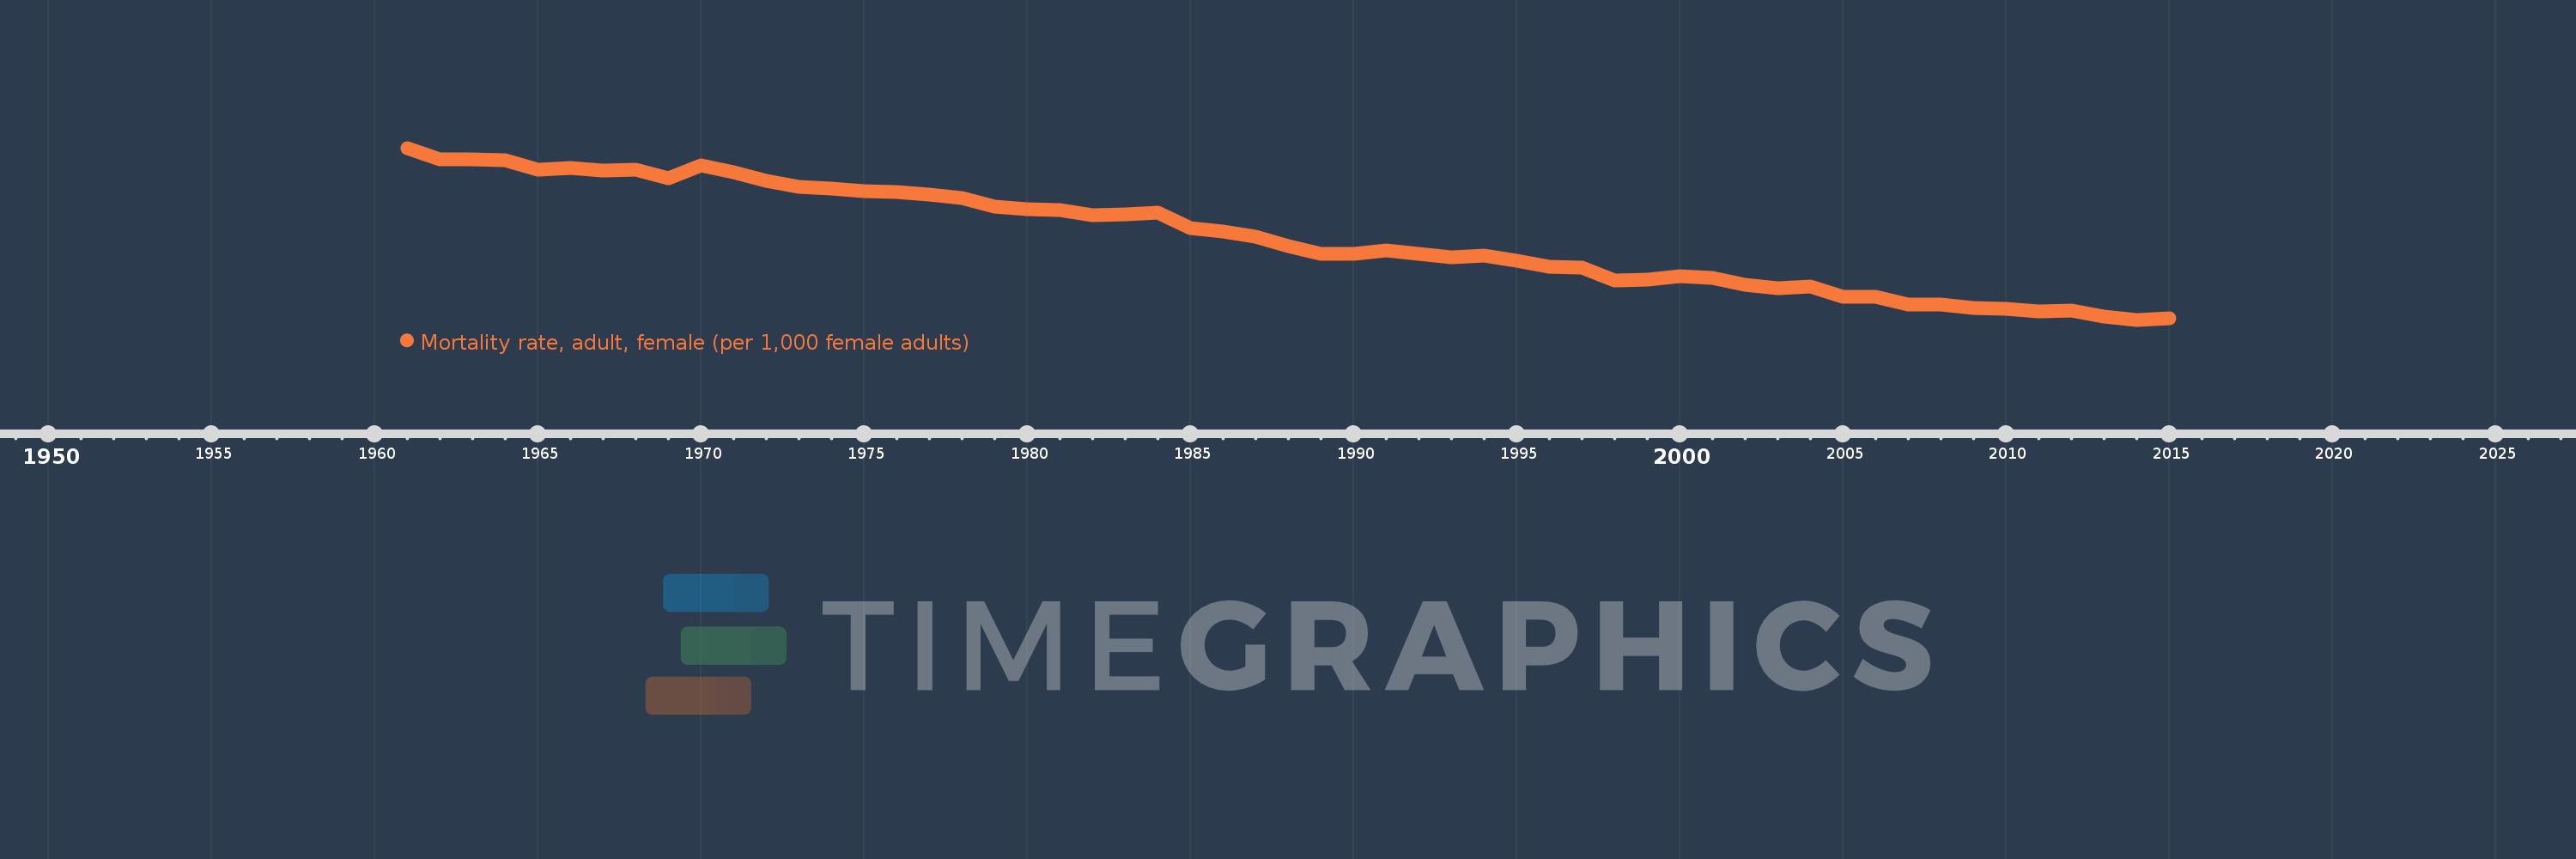
Mortality rate, adult, female (per 1,000 female adults)
2015,2014,2013,2012,2011,2010,2009,2008,2007,2006,2005,2004,2003,2002,2001,2000,1999,1998,1997,1996,1995,1994,1993,1992,1991,1990,1989,1988,1987,1986,1985,1984,1983,1982,1981,1980,1979,1978,1977,1976,1975,1974,1973,1972,1971,1970,1969,1968,1967,1966,1965,1964,1963,1962,1961
This statistics in other country:
AfghanistanAlbaniaAlgeriaAngolaAntigua and BarbudaArab WorldArgentinaArmeniaArubaAustraliaAustriaAzerbaijanBahamas, TheBahrainBangladeshBarbadosBelarusBelgiumBelizeBeninBhutanBoliviaBosnia and HerzegovinaBotswanaBrazilBrunei DarussalamBulgariaBurkina FasoBurundiCabo VerdeCambodiaCameroonCanadaCaribbean small statesCentral African RepublicCentral Europe and the BalticsChadChannel IslandsChileChinaColombiaComorosCongo, Dem. Rep.Congo, Rep.Costa RicaCote d'IvoireCroatiaCubaCuracaoCyprusCzech RepublicDenmarkDjiboutiDominicaDominican RepublicEarly-demographic dividendEast Asia & PacificEast Asia & Pacific (excluding high income)East Asia & Pacific (IDA & IBRD countries)EcuadorEgypt, Arab Rep.El SalvadorEquatorial GuineaEritreaEstoniaEthiopiaEuro areaEurope & Central AsiaEurope & Central Asia (excluding high income)Europe & Central Asia (IDA & IBRD countries)European UnionFijiFinlandFragile and conflict affected situationsFranceFrench PolynesiaGabonGambia, TheGeorgiaGermanyGhanaGreeceGreenlandGrenadaGuamGuatemalaGuineaGuinea-BissauGuyanaHaitiHeavily indebted poor countries (HIPC)High incomeHondurasHong Kong SAR, ChinaHungaryIBRD onlyIcelandIDA & IBRD totalIDA blendIDA onlyIDA totalIndiaIndonesiaIran, Islamic Rep.IraqIrelandIsraelItalyJamaicaJapanJordanKazakhstanKenyaKiribatiKorea, Dem. People’s Rep.Korea, Rep.KuwaitKyrgyz RepublicLao PDRLate-demographic dividendLatin America & Caribbean Latin America & Caribbean (excluding high income)Latin America & the Caribbean (IDA & IBRD countries)LatviaLeast developed countries: UN classificationLebanonLesothoLiberiaLibyaLithuaniaLow & middle incomeLow incomeLower middle incomeLuxembourgMacao SAR, ChinaMacedonia, FYRMadagascarMalawiMalaysiaMaldivesMaliMaltaMarshall IslandsMauritaniaMauritiusMexicoMicronesia, Fed. Sts.Middle East & North AfricaMiddle East & North Africa (excluding high income)Middle East & North Africa (IDA & IBRD countries)Middle incomeMoldovaMongoliaMontenegroMoroccoMozambiqueMyanmarNamibiaNepalNetherlandsNew CaledoniaNew ZealandNicaraguaNigerNigeriaNorth AmericaNorwayOECD membersOmanOther small statesPacific island small statesPakistanPanamaPapua New GuineaParaguayPeruPhilippinesPolandPortugalPost-demographic dividendPre-demographic dividendPuerto RicoQatarRomaniaRussian FederationRwandaSamoaSao Tome and PrincipeSaudi ArabiaSenegalSerbiaSeychellesSierra LeoneSingaporeSlovak RepublicSloveniaSmall statesSolomon IslandsSomaliaSouth AfricaSouth AsiaSouth Asia (IDA & IBRD)South SudanSpainSri LankaSt. Kitts and NevisSt. LuciaSt. Vincent and the GrenadinesSub-Saharan Africa Sub-Saharan Africa (excluding high income)Sub-Saharan Africa (IDA & IBRD countries)SudanSurinameSwazilandSwedenSwitzerlandSyrian Arab RepublicTajikistanTanzaniaThailandTimor-LesteTogoTongaTrinidad and TobagoTunisiaTurkeyTurkmenistanUgandaUkraineUnited Arab EmiratesUnited KingdomUnited StatesUpper middle incomeUruguayUzbekistanVanuatuVenezuela, RBVietnamVirgin Islands (U.S.)West Bank and GazaWorldYemen, Rep.ZambiaZimbabwe Timeline:
This timeline shows a graph from 1961 to 2015 of Austria. No data until 1960. Number of actual observations by date: 55.
Source name:
World Development Indicators
Source organization:
(1) United Nations Population Division. World Population Prospects. New York, United Nations, Department of Economic and Social Affairs (advanced Excel tables). Available at http://esa.un.org/wpp/unpp/panel_population.htm, (2) University of California, Berkeley, and Max Planck Institute for Demographic Research. Human Mortality Database. [ www.mortality.org or www.humanmortality.de].
Categories, topics:
Health, Gender
Last updated:
apr 23, 2017
Indicators value changes by year
Minimum:
45.316
jan 1, 2014
Maximum:
117.967
jan 1, 1961
At the date of observation
Value
Absolute change
Change from previous value
jan 1, 1961
117.967
+117.967
0.0%
jan 1, 1962
112.97
-4.997
-4.24%
jan 1, 1963
113.059
+0.089
0.08%
jan 1, 1964
112.629
-0.43
-0.38%
jan 1, 1965
108.695
-3.934
-3.49%
jan 1, 1966
109.451
+0.756
0.7%
jan 1, 1967
108.257
-1.194
-1.09%
jan 1, 1968
108.787
+0.53
0.49%
jan 1, 1969
105.005
-3.782
-3.48%
jan 1, 1970
110.577
+5.572
5.31%
jan 1, 1971
107.566
-3.011
-2.72%
jan 1, 1972
103.892
-3.674
-3.42%
jan 1, 1973
101.461
-2.431
-2.34%
jan 1, 1974
100.93
-0.531
-0.52%
jan 1, 1975
99.87
-1.06
-1.05%
jan 1, 1976
99.27
-0.6
-0.6%
jan 1, 1977
98.131
-1.139
-1.15%
jan 1, 1978
96.938
-1.193
-1.22%
jan 1, 1979
93.223
-3.715
-3.83%
jan 1, 1980
92.152
-1.071
-1.15%
jan 1, 1981
91.553
-0.599
-0.65%
jan 1, 1982
89.612
-1.941
-2.12%
jan 1, 1983
89.881
+0.269
0.3%
jan 1, 1984
90.61
+0.729
0.81%
jan 1, 1985
83.971
-6.639
-7.33%
jan 1, 1986
82.648
-1.323
-1.58%
jan 1, 1987
80.393
-2.255
-2.73%
jan 1, 1988
76.616
-3.777
-4.7%
jan 1, 1989
73.124
-3.492
-4.56%
jan 1, 1990
73.305
+0.181
0.25%
jan 1, 1991
74.515
+1.21
1.65%
jan 1, 1992
73.028
-1.487
-2.0%
jan 1, 1993
71.571
-1.457
-2.0%
jan 1, 1994
72.383
+0.812
1.13%
jan 1, 1995
70.396
-1.987
-2.75%
jan 1, 1996
67.807
-2.589
-3.68%
jan 1, 1997
67.344
-0.463
-0.68%
jan 1, 1998
61.936
-5.408
-8.03%
jan 1, 1999
62.302
+0.366
0.59%
jan 1, 2000
63.655
+1.353
2.17%
jan 1, 2001
63.086
-0.569
-0.89%
jan 1, 2002
60.189
-2.897
-4.59%
jan 1, 2003
58.798
-1.391
-2.31%
jan 1, 2004
59.511
+0.713
1.21%
jan 1, 2005
54.984
-4.527
-7.61%
jan 1, 2006
55.04
+0.056
0.1%
jan 1, 2007
51.653
-3.387
-6.15%
jan 1, 2008
51.827
+0.174
0.34%
jan 1, 2009
50.272
-1.555
-3.0%
jan 1, 2010
50.029
-0.243
-0.48%
jan 1, 2011
48.679
-1.35
-2.7%
jan 1, 2012
49.343
+0.664
1.36%
jan 1, 2013
46.718
-2.625
-5.32%
jan 1, 2014
45.316
-1.402
-3.0%
jan 1, 2015
46.009
+0.693
1.53%
Ranking of countries by current statistics by years


Comments: