29
/
en
AIzaSyAYiBZKx7MnpbEhh9jyipgxe19OcubqV5w
April 1, 2024
143832
Guam
GUM
true
2
1
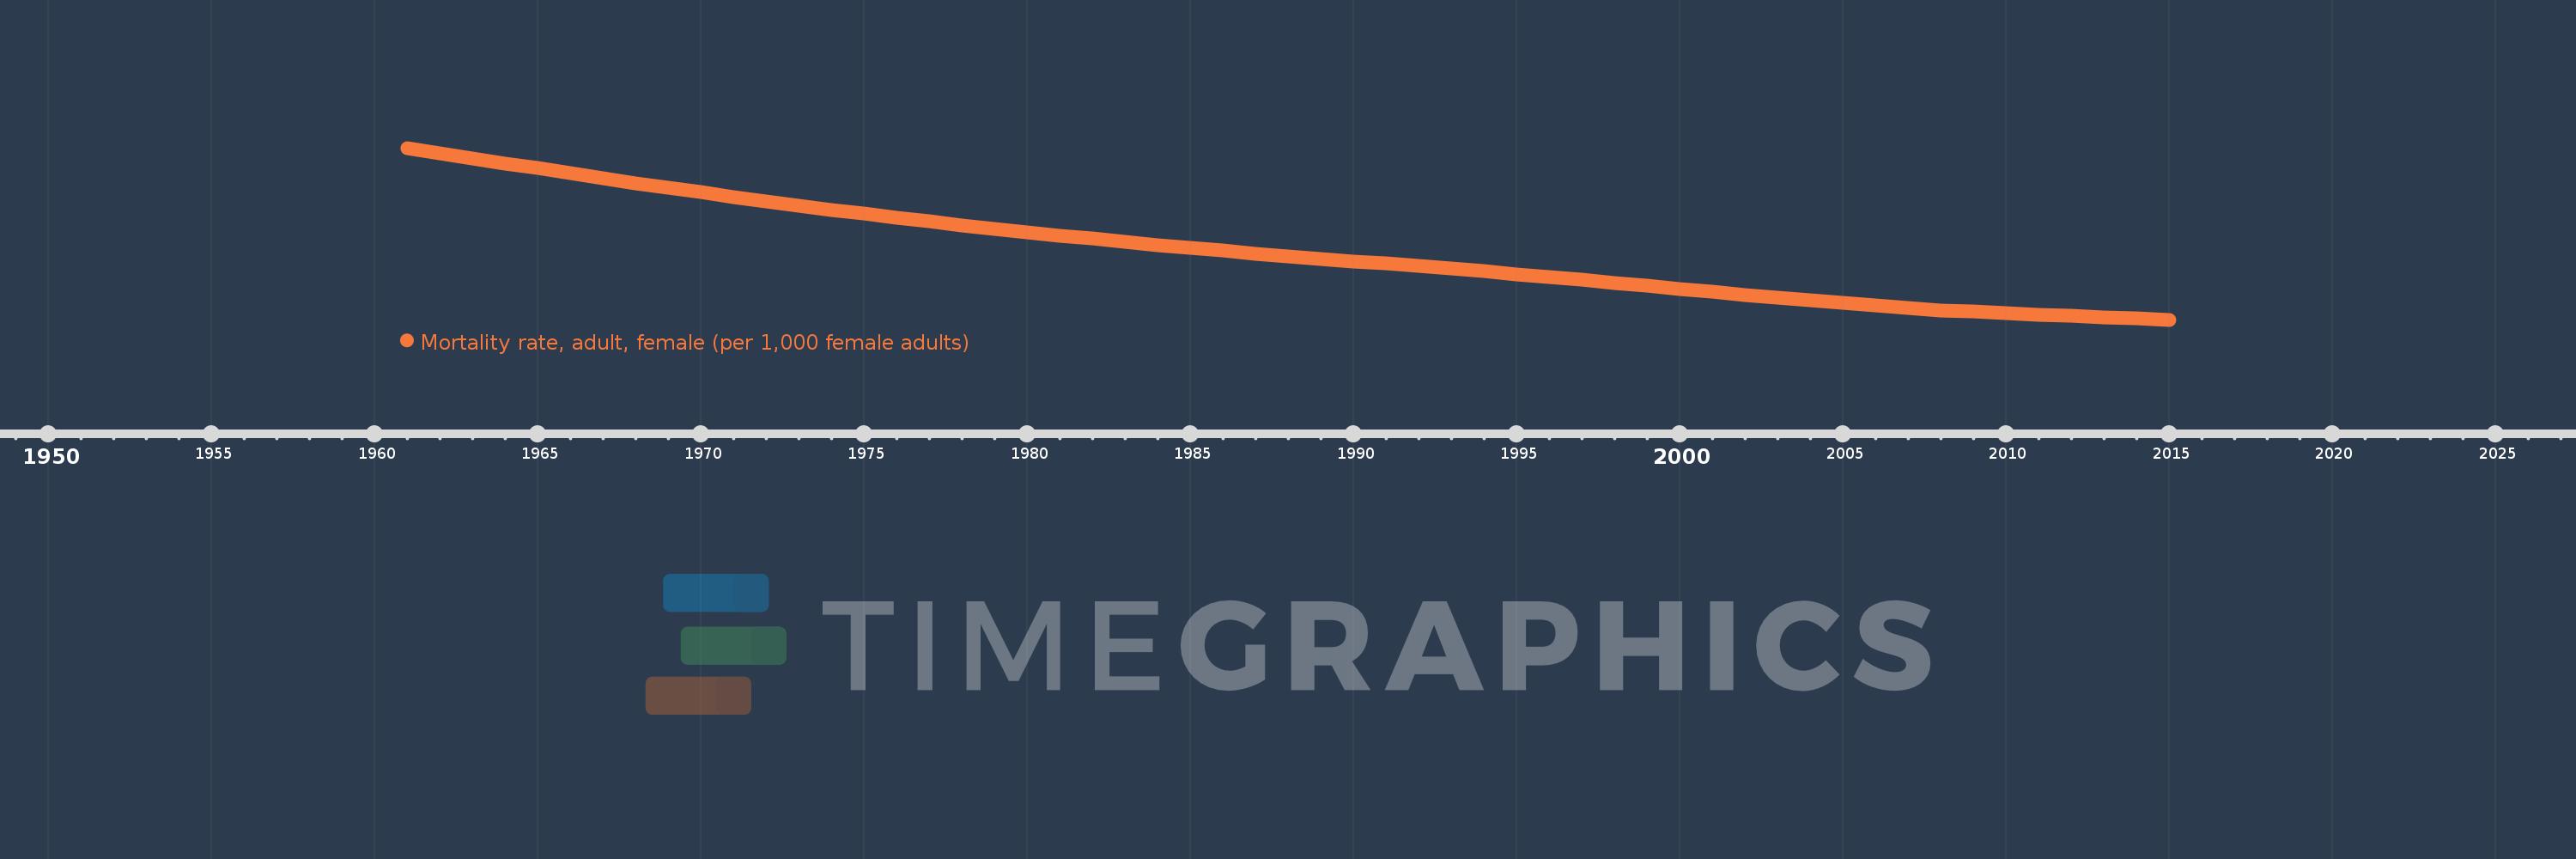
Mortality rate, adult, female (per 1,000 female adults)
2015,2014,2013,2012,2011,2010,2009,2008,2007,2006,2005,2004,2003,2002,2001,2000,1999,1998,1997,1996,1995,1994,1993,1992,1991,1990,1989,1988,1987,1986,1985,1984,1983,1982,1981,1980,1979,1978,1977,1976,1975,1974,1973,1972,1971,1970,1969,1968,1967,1966,1965,1964,1963,1962,1961
This statistics in other country:
AfghanistanAlbaniaAlgeriaAngolaAntigua and BarbudaArab WorldArgentinaArmeniaArubaAustraliaAustriaAzerbaijanBahamas, TheBahrainBangladeshBarbadosBelarusBelgiumBelizeBeninBhutanBoliviaBosnia and HerzegovinaBotswanaBrazilBrunei DarussalamBulgariaBurkina FasoBurundiCabo VerdeCambodiaCameroonCanadaCaribbean small statesCentral African RepublicCentral Europe and the BalticsChadChannel IslandsChileChinaColombiaComorosCongo, Dem. Rep.Congo, Rep.Costa RicaCote d'IvoireCroatiaCubaCuracaoCyprusCzech RepublicDenmarkDjiboutiDominicaDominican RepublicEarly-demographic dividendEast Asia & PacificEast Asia & Pacific (excluding high income)East Asia & Pacific (IDA & IBRD countries)EcuadorEgypt, Arab Rep.El SalvadorEquatorial GuineaEritreaEstoniaEthiopiaEuro areaEurope & Central AsiaEurope & Central Asia (excluding high income)Europe & Central Asia (IDA & IBRD countries)European UnionFijiFinlandFragile and conflict affected situationsFranceFrench PolynesiaGabonGambia, TheGeorgiaGermanyGhanaGreeceGreenlandGrenadaGuamGuatemalaGuineaGuinea-BissauGuyanaHaitiHeavily indebted poor countries (HIPC)High incomeHondurasHong Kong SAR, ChinaHungaryIBRD onlyIcelandIDA & IBRD totalIDA blendIDA onlyIDA totalIndiaIndonesiaIran, Islamic Rep.IraqIrelandIsraelItalyJamaicaJapanJordanKazakhstanKenyaKiribatiKorea, Dem. People’s Rep.Korea, Rep.KuwaitKyrgyz RepublicLao PDRLate-demographic dividendLatin America & Caribbean Latin America & Caribbean (excluding high income)Latin America & the Caribbean (IDA & IBRD countries)LatviaLeast developed countries: UN classificationLebanonLesothoLiberiaLibyaLithuaniaLow & middle incomeLow incomeLower middle incomeLuxembourgMacao SAR, ChinaMacedonia, FYRMadagascarMalawiMalaysiaMaldivesMaliMaltaMarshall IslandsMauritaniaMauritiusMexicoMicronesia, Fed. Sts.Middle East & North AfricaMiddle East & North Africa (excluding high income)Middle East & North Africa (IDA & IBRD countries)Middle incomeMoldovaMongoliaMontenegroMoroccoMozambiqueMyanmarNamibiaNepalNetherlandsNew CaledoniaNew ZealandNicaraguaNigerNigeriaNorth AmericaNorwayOECD membersOmanOther small statesPacific island small statesPakistanPanamaPapua New GuineaParaguayPeruPhilippinesPolandPortugalPost-demographic dividendPre-demographic dividendPuerto RicoQatarRomaniaRussian FederationRwandaSamoaSao Tome and PrincipeSaudi ArabiaSenegalSerbiaSeychellesSierra LeoneSingaporeSlovak RepublicSloveniaSmall statesSolomon IslandsSomaliaSouth AfricaSouth AsiaSouth Asia (IDA & IBRD)South SudanSpainSri LankaSt. Kitts and NevisSt. LuciaSt. Vincent and the GrenadinesSub-Saharan Africa Sub-Saharan Africa (excluding high income)Sub-Saharan Africa (IDA & IBRD countries)SudanSurinameSwazilandSwedenSwitzerlandSyrian Arab RepublicTajikistanTanzaniaThailandTimor-LesteTogoTongaTrinidad and TobagoTunisiaTurkeyTurkmenistanUgandaUkraineUnited Arab EmiratesUnited KingdomUnited StatesUpper middle incomeUruguayUzbekistanVanuatuVenezuela, RBVietnamVirgin Islands (U.S.)West Bank and GazaWorldYemen, Rep.ZambiaZimbabwe Timeline:
This timeline shows a graph from 1961 to 2015 of Guam. No data until 1960. Number of actual observations by date: 55.
Source name:
World Development Indicators
Source organization:
(1) United Nations Population Division. World Population Prospects. New York, United Nations, Department of Economic and Social Affairs (advanced Excel tables). Available at http://esa.un.org/wpp/unpp/panel_population.htm, (2) University of California, Berkeley, and Max Planck Institute for Demographic Research. Human Mortality Database. [ www.mortality.org or www.humanmortality.de].
Categories, topics:
Health, Gender
Last updated:
apr 23, 2017
Indicators value changes by year
Minimum:
47.235
jan 1, 2015
Maximum:
218.225
jan 1, 1961
At the date of observation
Value
Absolute change
Change from previous value
jan 1, 1961
218.225
+218.225
0.0%
jan 1, 1962
213.042
-5.183
-2.38%
jan 1, 1963
207.859
-5.183
-2.43%
jan 1, 1964
202.901
-4.958
-2.39%
jan 1, 1965
197.944
-4.957
-2.44%
jan 1, 1966
192.986
-4.958
-2.5%
jan 1, 1967
188.028
-4.958
-2.57%
jan 1, 1968
183.071
-4.957
-2.64%
jan 1, 1969
178.512
-4.559
-2.49%
jan 1, 1970
173.953
-4.559
-2.55%
jan 1, 1971
169.393
-4.56
-2.62%
jan 1, 1972
164.834
-4.559
-2.69%
jan 1, 1973
160.275
-4.559
-2.77%
jan 1, 1974
156.435
-3.84
-2.4%
jan 1, 1975
152.595
-3.84
-2.45%
jan 1, 1976
148.754
-3.841
-2.52%
jan 1, 1977
144.914
-3.84
-2.58%
jan 1, 1978
141.074
-3.84
-2.65%
jan 1, 1979
137.756
-3.318
-2.35%
jan 1, 1980
134.438
-3.318
-2.41%
jan 1, 1981
131.121
-3.317
-2.47%
jan 1, 1982
127.803
-3.318
-2.53%
jan 1, 1983
124.485
-3.318
-2.6%
jan 1, 1984
121.648
-2.837
-2.28%
jan 1, 1985
118.811
-2.837
-2.33%
jan 1, 1986
115.974
-2.837
-2.39%
jan 1, 1987
113.136
-2.838
-2.45%
jan 1, 1988
110.299
-2.837
-2.51%
jan 1, 1989
107.889
-2.41
-2.18%
jan 1, 1990
105.479
-2.41
-2.23%
jan 1, 1991
103.07
-2.409
-2.28%
jan 1, 1992
100.66
-2.41
-2.34%
jan 1, 1993
98.25
-2.41
-2.39%
jan 1, 1994
95.421
-2.829
-2.88%
jan 1, 1995
92.593
-2.828
-2.96%
jan 1, 1996
89.765
-2.828
-3.05%
jan 1, 1997
86.936
-2.829
-3.15%
jan 1, 1998
84.108
-2.828
-3.25%
jan 1, 1999
81.09
-3.018
-3.59%
jan 1, 2000
78.072
-3.018
-3.72%
jan 1, 2001
75.054
-3.018
-3.87%
jan 1, 2002
72.036
-3.018
-4.02%
jan 1, 2003
69.017
-3.019
-4.19%
jan 1, 2004
66.565
-2.452
-3.55%
jan 1, 2005
64.112
-2.453
-3.69%
jan 1, 2006
61.659
-2.453
-3.83%
jan 1, 2007
59.206
-2.453
-3.98%
jan 1, 2008
56.753
-2.453
-4.14%
jan 1, 2009
55.329
-1.424
-2.51%
jan 1, 2010
53.905
-1.424
-2.57%
jan 1, 2011
52.48
-1.425
-2.64%
jan 1, 2012
51.056
-1.424
-2.71%
jan 1, 2013
49.632
-1.424
-2.79%
jan 1, 2014
48.433
-1.199
-2.42%
jan 1, 2015
47.235
-1.198
-2.47%
Ranking of countries by current statistics by years


Comments: