29
/
en
AIzaSyAYiBZKx7MnpbEhh9jyipgxe19OcubqV5w
April 1, 2024
162870
Jamaica
JAM
true
2
1
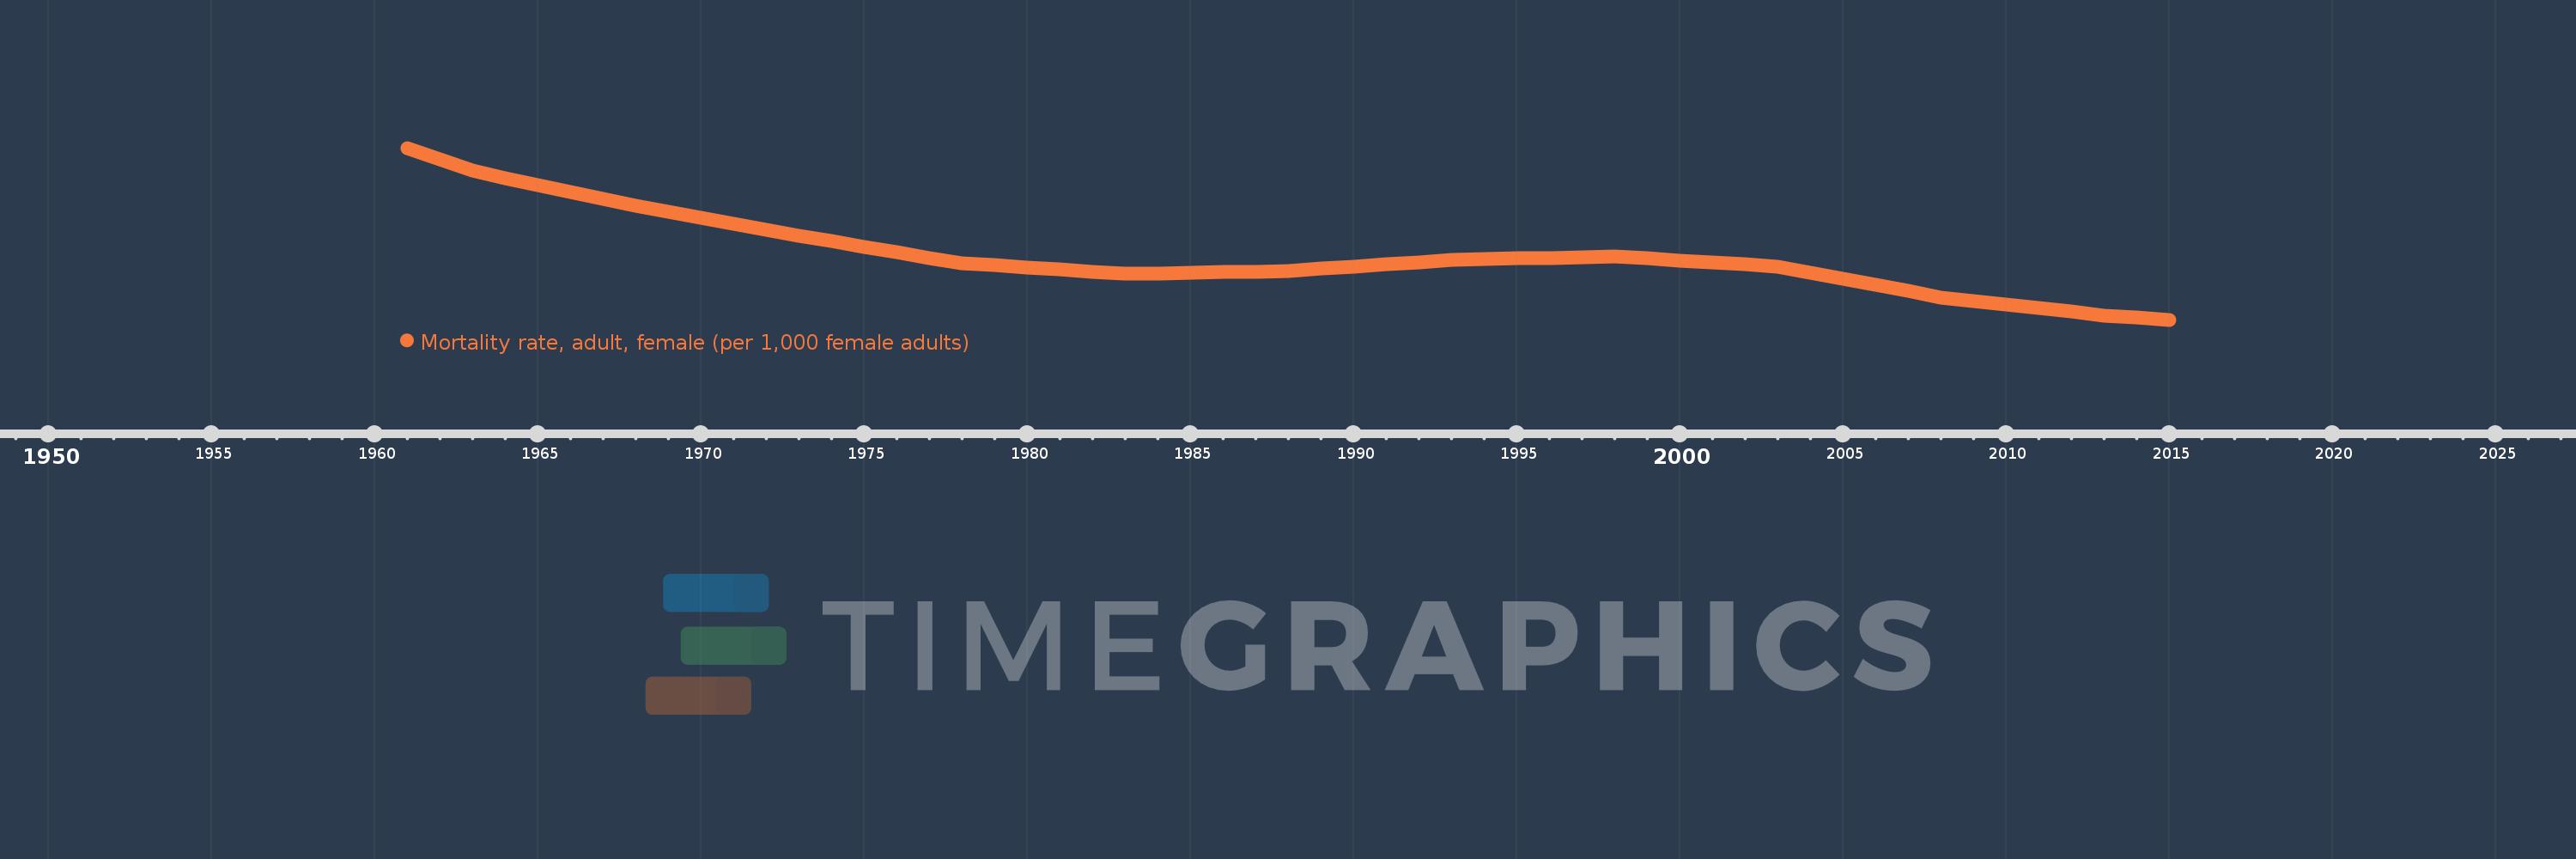
Mortality rate, adult, female (per 1,000 female adults)
2015,2014,2013,2012,2011,2010,2009,2008,2007,2006,2005,2004,2003,2002,2001,2000,1999,1998,1997,1996,1995,1994,1993,1992,1991,1990,1989,1988,1987,1986,1985,1984,1983,1982,1981,1980,1979,1978,1977,1976,1975,1974,1973,1972,1971,1970,1969,1968,1967,1966,1965,1964,1963,1962,1961
This statistics in other country:
AfghanistanAlbaniaAlgeriaAngolaAntigua and BarbudaArab WorldArgentinaArmeniaArubaAustraliaAustriaAzerbaijanBahamas, TheBahrainBangladeshBarbadosBelarusBelgiumBelizeBeninBhutanBoliviaBosnia and HerzegovinaBotswanaBrazilBrunei DarussalamBulgariaBurkina FasoBurundiCabo VerdeCambodiaCameroonCanadaCaribbean small statesCentral African RepublicCentral Europe and the BalticsChadChannel IslandsChileChinaColombiaComorosCongo, Dem. Rep.Congo, Rep.Costa RicaCote d'IvoireCroatiaCubaCuracaoCyprusCzech RepublicDenmarkDjiboutiDominicaDominican RepublicEarly-demographic dividendEast Asia & PacificEast Asia & Pacific (excluding high income)East Asia & Pacific (IDA & IBRD countries)EcuadorEgypt, Arab Rep.El SalvadorEquatorial GuineaEritreaEstoniaEthiopiaEuro areaEurope & Central AsiaEurope & Central Asia (excluding high income)Europe & Central Asia (IDA & IBRD countries)European UnionFijiFinlandFragile and conflict affected situationsFranceFrench PolynesiaGabonGambia, TheGeorgiaGermanyGhanaGreeceGreenlandGrenadaGuamGuatemalaGuineaGuinea-BissauGuyanaHaitiHeavily indebted poor countries (HIPC)High incomeHondurasHong Kong SAR, ChinaHungaryIBRD onlyIcelandIDA & IBRD totalIDA blendIDA onlyIDA totalIndiaIndonesiaIran, Islamic Rep.IraqIrelandIsraelItalyJamaicaJapanJordanKazakhstanKenyaKiribatiKorea, Dem. People’s Rep.Korea, Rep.KuwaitKyrgyz RepublicLao PDRLate-demographic dividendLatin America & Caribbean Latin America & Caribbean (excluding high income)Latin America & the Caribbean (IDA & IBRD countries)LatviaLeast developed countries: UN classificationLebanonLesothoLiberiaLibyaLithuaniaLow & middle incomeLow incomeLower middle incomeLuxembourgMacao SAR, ChinaMacedonia, FYRMadagascarMalawiMalaysiaMaldivesMaliMaltaMarshall IslandsMauritaniaMauritiusMexicoMicronesia, Fed. Sts.Middle East & North AfricaMiddle East & North Africa (excluding high income)Middle East & North Africa (IDA & IBRD countries)Middle incomeMoldovaMongoliaMontenegroMoroccoMozambiqueMyanmarNamibiaNepalNetherlandsNew CaledoniaNew ZealandNicaraguaNigerNigeriaNorth AmericaNorwayOECD membersOmanOther small statesPacific island small statesPakistanPanamaPapua New GuineaParaguayPeruPhilippinesPolandPortugalPost-demographic dividendPre-demographic dividendPuerto RicoQatarRomaniaRussian FederationRwandaSamoaSao Tome and PrincipeSaudi ArabiaSenegalSerbiaSeychellesSierra LeoneSingaporeSlovak RepublicSloveniaSmall statesSolomon IslandsSomaliaSouth AfricaSouth AsiaSouth Asia (IDA & IBRD)South SudanSpainSri LankaSt. Kitts and NevisSt. LuciaSt. Vincent and the GrenadinesSub-Saharan Africa Sub-Saharan Africa (excluding high income)Sub-Saharan Africa (IDA & IBRD countries)SudanSurinameSwazilandSwedenSwitzerlandSyrian Arab RepublicTajikistanTanzaniaThailandTimor-LesteTogoTongaTrinidad and TobagoTunisiaTurkeyTurkmenistanUgandaUkraineUnited Arab EmiratesUnited KingdomUnited StatesUpper middle incomeUruguayUzbekistanVanuatuVenezuela, RBVietnamVirgin Islands (U.S.)West Bank and GazaWorldYemen, Rep.ZambiaZimbabwe Timeline:
This timeline shows a graph from 1961 to 2015 of Jamaica. No data until 1960. Number of actual observations by date: 55.
Source name:
World Development Indicators
Source organization:
(1) United Nations Population Division. World Population Prospects. New York, United Nations, Department of Economic and Social Affairs (advanced Excel tables). Available at http://esa.un.org/wpp/unpp/panel_population.htm, (2) University of California, Berkeley, and Max Planck Institute for Demographic Research. Human Mortality Database. [ www.mortality.org or www.humanmortality.de].
Categories, topics:
Health, Gender
Last updated:
apr 23, 2017
Indicators value changes by year
Minimum:
101.03
jan 1, 2015
Maximum:
171.533
jan 1, 1961
At the date of observation
Value
Absolute change
Change from previous value
jan 1, 1961
171.533
+171.533
0.0%
jan 1, 1962
166.824
-4.709
-2.75%
jan 1, 1963
162.114
-4.71
-2.82%
jan 1, 1964
159.226
-2.888
-1.78%
jan 1, 1965
156.339
-2.887
-1.81%
jan 1, 1966
153.451
-2.888
-1.85%
jan 1, 1967
150.563
-2.888
-1.88%
jan 1, 1968
147.676
-2.887
-1.92%
jan 1, 1969
145.242
-2.434
-1.65%
jan 1, 1970
142.808
-2.434
-1.68%
jan 1, 1971
140.373
-2.435
-1.71%
jan 1, 1972
137.939
-2.434
-1.73%
jan 1, 1973
135.505
-2.434
-1.76%
jan 1, 1974
133.242
-2.263
-1.67%
jan 1, 1975
130.98
-2.262
-1.7%
jan 1, 1976
128.717
-2.263
-1.73%
jan 1, 1977
126.454
-2.263
-1.76%
jan 1, 1978
124.192
-2.262
-1.79%
jan 1, 1979
123.314
-0.878
-0.71%
jan 1, 1980
122.436
-0.878
-0.71%
jan 1, 1981
121.557
-0.879
-0.72%
jan 1, 1982
120.679
-0.878
-0.72%
jan 1, 1983
119.801
-0.878
-0.73%
jan 1, 1984
120.057
+0.256
0.21%
jan 1, 1985
120.313
+0.256
0.21%
jan 1, 1986
120.569
+0.256
0.21%
jan 1, 1987
120.825
+0.256
0.21%
jan 1, 1988
121.081
+0.256
0.21%
jan 1, 1989
121.983
+0.902
0.74%
jan 1, 1990
122.886
+0.903
0.74%
jan 1, 1991
123.788
+0.902
0.73%
jan 1, 1992
124.69
+0.902
0.73%
jan 1, 1993
125.593
+0.903
0.72%
jan 1, 1994
125.872
+0.279
0.22%
jan 1, 1995
126.151
+0.279
0.22%
jan 1, 1996
126.43
+0.279
0.22%
jan 1, 1997
126.709
+0.279
0.22%
jan 1, 1998
126.988
+0.279
0.22%
jan 1, 1999
126.179
-0.809
-0.64%
jan 1, 2000
125.371
-0.808
-0.64%
jan 1, 2001
124.562
-0.809
-0.65%
jan 1, 2002
123.753
-0.809
-0.65%
jan 1, 2003
122.944
-0.809
-0.65%
jan 1, 2004
120.406
-2.538
-2.06%
jan 1, 2005
117.868
-2.538
-2.11%
jan 1, 2006
115.33
-2.538
-2.15%
jan 1, 2007
112.792
-2.538
-2.2%
jan 1, 2008
110.254
-2.538
-2.25%
jan 1, 2009
108.764
-1.49
-1.35%
jan 1, 2010
107.273
-1.491
-1.37%
jan 1, 2011
105.783
-1.49
-1.39%
jan 1, 2012
104.293
-1.49
-1.41%
jan 1, 2013
102.802
-1.491
-1.43%
jan 1, 2014
101.916
-0.886
-0.86%
jan 1, 2015
101.03
-0.886
-0.87%
Ranking of countries by current statistics by years


Comments: