29
/
en
AIzaSyAYiBZKx7MnpbEhh9jyipgxe19OcubqV5w
April 1, 2024
97303
Cabo Verde
CPV
true
2
1
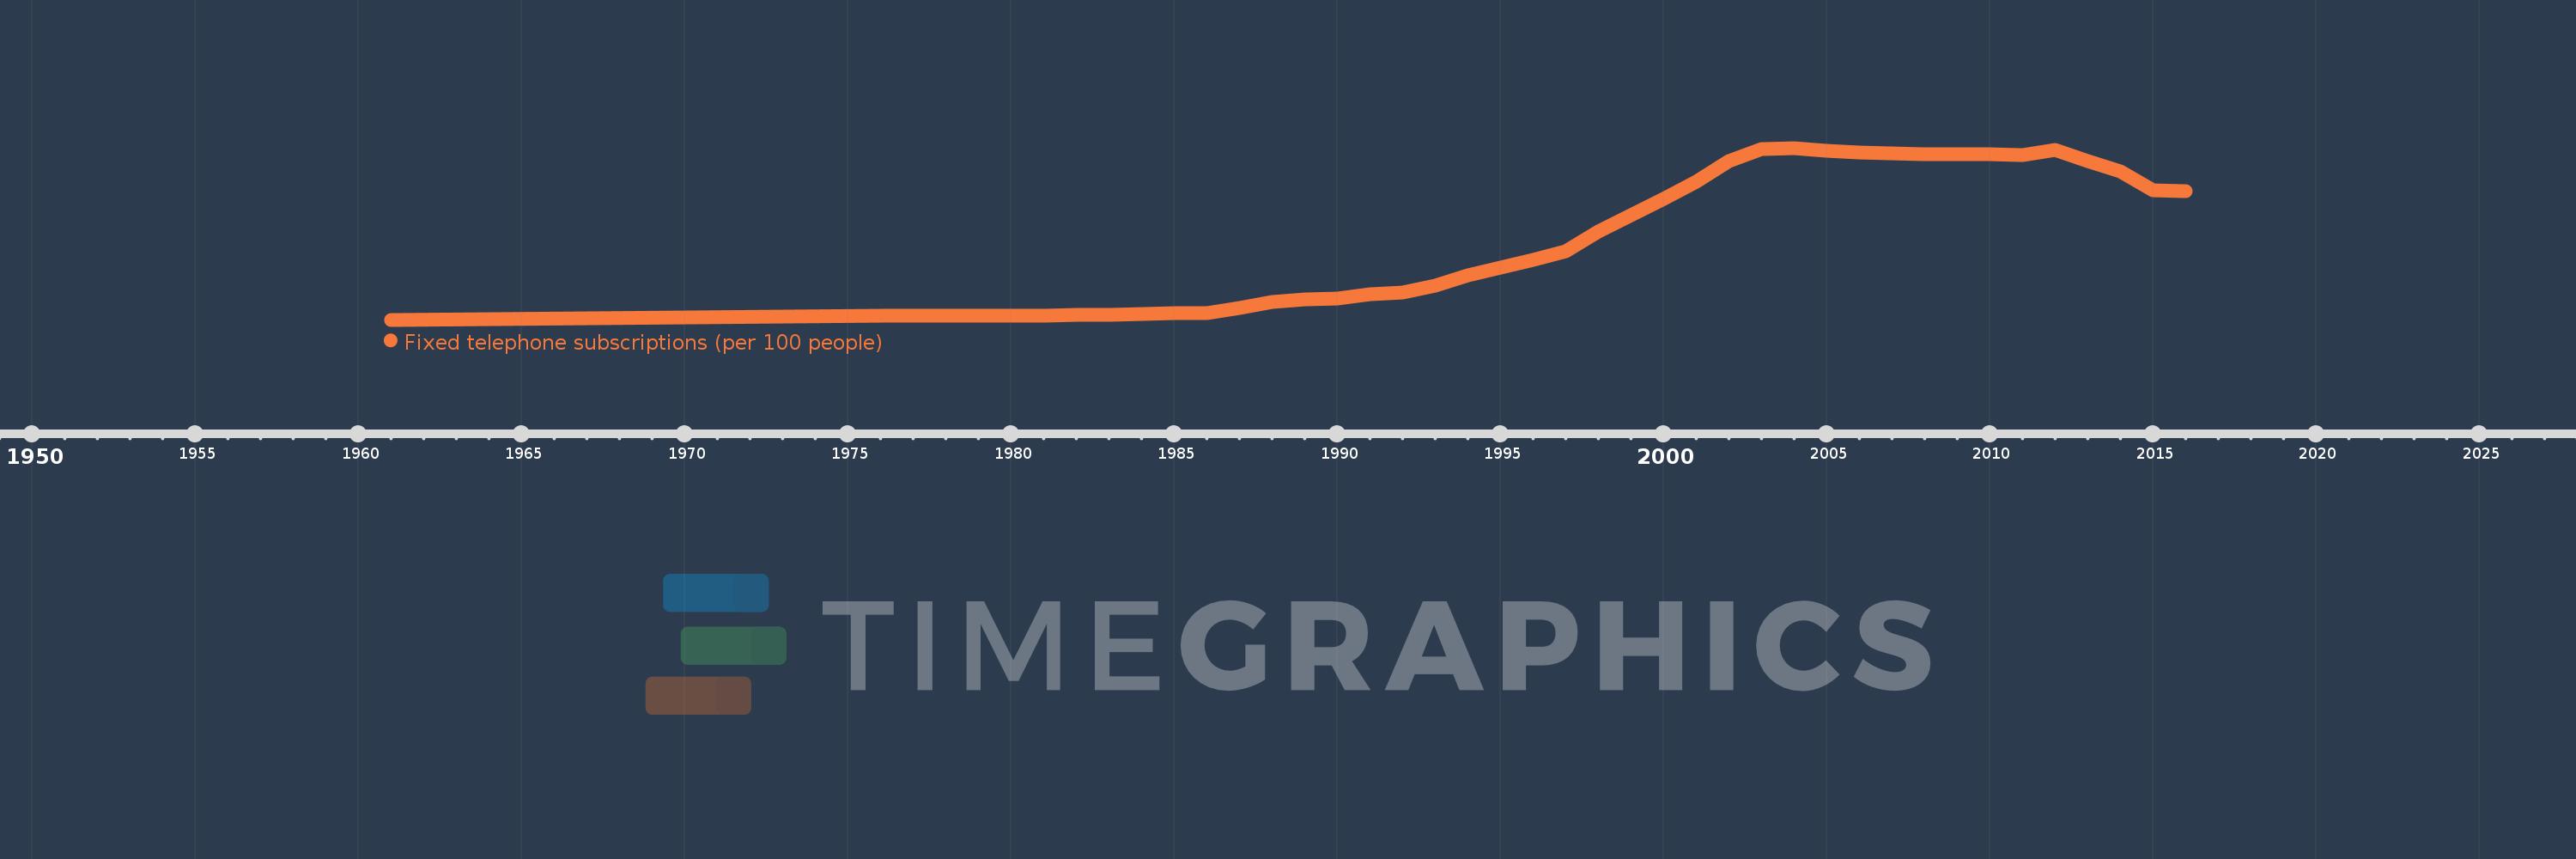
Fixed telephone subscriptions (per 100 people)
2016,2015,2014,2013,2012,2011,2010,2009,2008,2007,2006,2005,2004,2003,2002,2001,2000,1999,1998,1997,1996,1995,1994,1993,1992,1991,1990,1989,1988,1987,1986,1985,1984,1983,1982,1981,1976,1961
This statistics in other country:
AfghanistanAlbaniaAlgeriaAmerican SamoaAndorraAngolaAntigua and BarbudaArab WorldArgentinaArmeniaArubaAustraliaAustriaAzerbaijanBahamas, TheBahrainBangladeshBarbadosBelarusBelgiumBelizeBeninBermudaBhutanBoliviaBosnia and HerzegovinaBotswanaBrazilBritish Virgin IslandsBrunei DarussalamBulgariaBurkina FasoBurundiCabo VerdeCambodiaCameroonCanadaCaribbean small statesCayman IslandsCentral African RepublicCentral Europe and the BalticsChadChileChinaColombiaComorosCongo, Dem. Rep.Congo, Rep.Costa RicaCote d'IvoireCroatiaCubaCuracaoCyprusCzech RepublicDenmarkDjiboutiDominicaDominican RepublicEarly-demographic dividendEast Asia & PacificEast Asia & Pacific (excluding high income)East Asia & Pacific (IDA & IBRD countries)EcuadorEgypt, Arab Rep.El SalvadorEquatorial GuineaEritreaEstoniaEthiopiaEuro areaEurope & Central AsiaEurope & Central Asia (excluding high income)Europe & Central Asia (IDA & IBRD countries)European UnionFaroe IslandsFijiFinlandFragile and conflict affected situationsFranceFrench PolynesiaGabonGambia, TheGeorgiaGermanyGhanaGibraltarGreeceGreenlandGrenadaGuamGuatemalaGuineaGuinea-BissauGuyanaHaitiHeavily indebted poor countries (HIPC)High incomeHondurasHong Kong SAR, ChinaHungaryIBRD onlyIcelandIDA & IBRD totalIDA blendIDA onlyIDA totalIndiaIndonesiaIran, Islamic Rep.IraqIrelandIsraelItalyJamaicaJapanJordanKazakhstanKenyaKiribatiKorea, Dem. People’s Rep.Korea, Rep.KosovoKuwaitKyrgyz RepublicLao PDRLate-demographic dividendLatin America & Caribbean Latin America & Caribbean (excluding high income)Latin America & the Caribbean (IDA & IBRD countries)LatviaLeast developed countries: UN classificationLebanonLesothoLiberiaLibyaLiechtensteinLithuaniaLow & middle incomeLow incomeLower middle incomeLuxembourgMacao SAR, ChinaMacedonia, FYRMadagascarMalawiMalaysiaMaldivesMaliMaltaMarshall IslandsMauritaniaMauritiusMexicoMicronesia, Fed. Sts.Middle East & North AfricaMiddle East & North Africa (excluding high income)Middle East & North Africa (IDA & IBRD countries)Middle incomeMoldovaMonacoMongoliaMontenegroMoroccoMozambiqueMyanmarNamibiaNauruNepalNetherlandsNew CaledoniaNew ZealandNicaraguaNigerNigeriaNorth AmericaNorthern Mariana IslandsNorwayOECD membersOmanOther small statesPacific island small statesPakistanPalauPanamaPapua New GuineaParaguayPeruPhilippinesPolandPortugalPost-demographic dividendPre-demographic dividendPuerto RicoQatarRomaniaRussian FederationRwandaSamoaSan MarinoSao Tome and PrincipeSaudi ArabiaSenegalSerbiaSeychellesSierra LeoneSingaporeSlovak RepublicSloveniaSmall statesSolomon IslandsSomaliaSouth AfricaSouth AsiaSouth Asia (IDA & IBRD)South SudanSpainSri LankaSt. Kitts and NevisSt. LuciaSt. Vincent and the GrenadinesSub-Saharan Africa Sub-Saharan Africa (excluding high income)Sub-Saharan Africa (IDA & IBRD countries)SudanSurinameSwazilandSwedenSwitzerlandSyrian Arab RepublicTajikistanTanzaniaThailandTimor-LesteTogoTongaTrinidad and TobagoTunisiaTurkeyTurkmenistanTurks and Caicos IslandsTuvaluUgandaUkraineUnited Arab EmiratesUnited KingdomUnited StatesUpper middle incomeUruguayUzbekistanVanuatuVenezuela, RBVietnamVirgin Islands (U.S.)West Bank and GazaWorldYemen, Rep.ZambiaZimbabwe Timeline:
This timeline shows a graph from 1961 to 2016 of Cabo Verde. No data until 1960. Number of actual observations by date: 38.
Source name:
World Development Indicators
Source organization:
International Telecommunication Union, World Telecommunication/ICT Development Report and database.
Categories, topics:
Infrastructure
Last updated:
apr 23, 2017
Indicators value changes by year
Maximum:
15.359
jan 1, 2004
At the date of observation
Value
Absolute change
Change from previous value
jan 1, 1961
0.089
+0.089
0.0%
jan 1, 1976
0.477
+0.388
438.44%
jan 1, 1981
0.477
+0.0
0.04%
jan 1, 1982
0.514
+0.037
7.75%
jan 1, 1983
0.548
+0.034
6.64%
jan 1, 1984
0.595
+0.047
8.6%
jan 1, 1985
0.674
+0.079
13.25%
jan 1, 1986
0.689
+0.015
2.26%
jan 1, 1987
1.109
+0.42
60.89%
jan 1, 1988
1.656
+0.547
49.29%
jan 1, 1989
1.872
+0.216
13.05%
jan 1, 1990
1.964
+0.092
4.91%
jan 1, 1991
2.343
+0.379
19.28%
jan 1, 1992
2.529
+0.186
7.94%
jan 1, 1993
3.153
+0.624
24.66%
jan 1, 1994
4.023
+0.871
27.62%
jan 1, 1995
4.737
+0.714
17.74%
jan 1, 1996
5.385
+0.648
13.69%
jan 1, 1997
6.172
+0.787
14.62%
jan 1, 1998
7.961
+1.788
28.97%
jan 1, 1999
9.388
+1.427
17.92%
jan 1, 2000
10.794
+1.407
14.98%
jan 1, 2001
12.351
+1.557
14.42%
jan 1, 2002
14.226
+1.875
15.18%
jan 1, 2003
15.287
+1.061
7.46%
jan 1, 2004
15.359
+0.072
0.47%
jan 1, 2005
15.14
-0.219
-1.42%
jan 1, 2006
14.959
-0.181
-1.2%
jan 1, 2007
14.852
-0.107
-0.71%
jan 1, 2008
14.836
-0.016
-0.11%
jan 1, 2009
14.827
-0.009
-0.06%
jan 1, 2010
14.798
-0.03
-0.2%
jan 1, 2011
14.76
-0.037
-0.25%
jan 1, 2012
15.187
+0.427
2.89%
jan 1, 2013
14.203
-0.984
-6.48%
jan 1, 2014
13.265
-0.938
-6.61%
jan 1, 2015
11.622
-1.642
-12.38%
jan 1, 2016
11.5
-0.122
-1.05%
Ranking of countries by current statistics by years


Comments: