29
/
en
AIzaSyAYiBZKx7MnpbEhh9jyipgxe19OcubqV5w
April 1, 2024
219554
Papua New Guinea
PNG
true
2
1
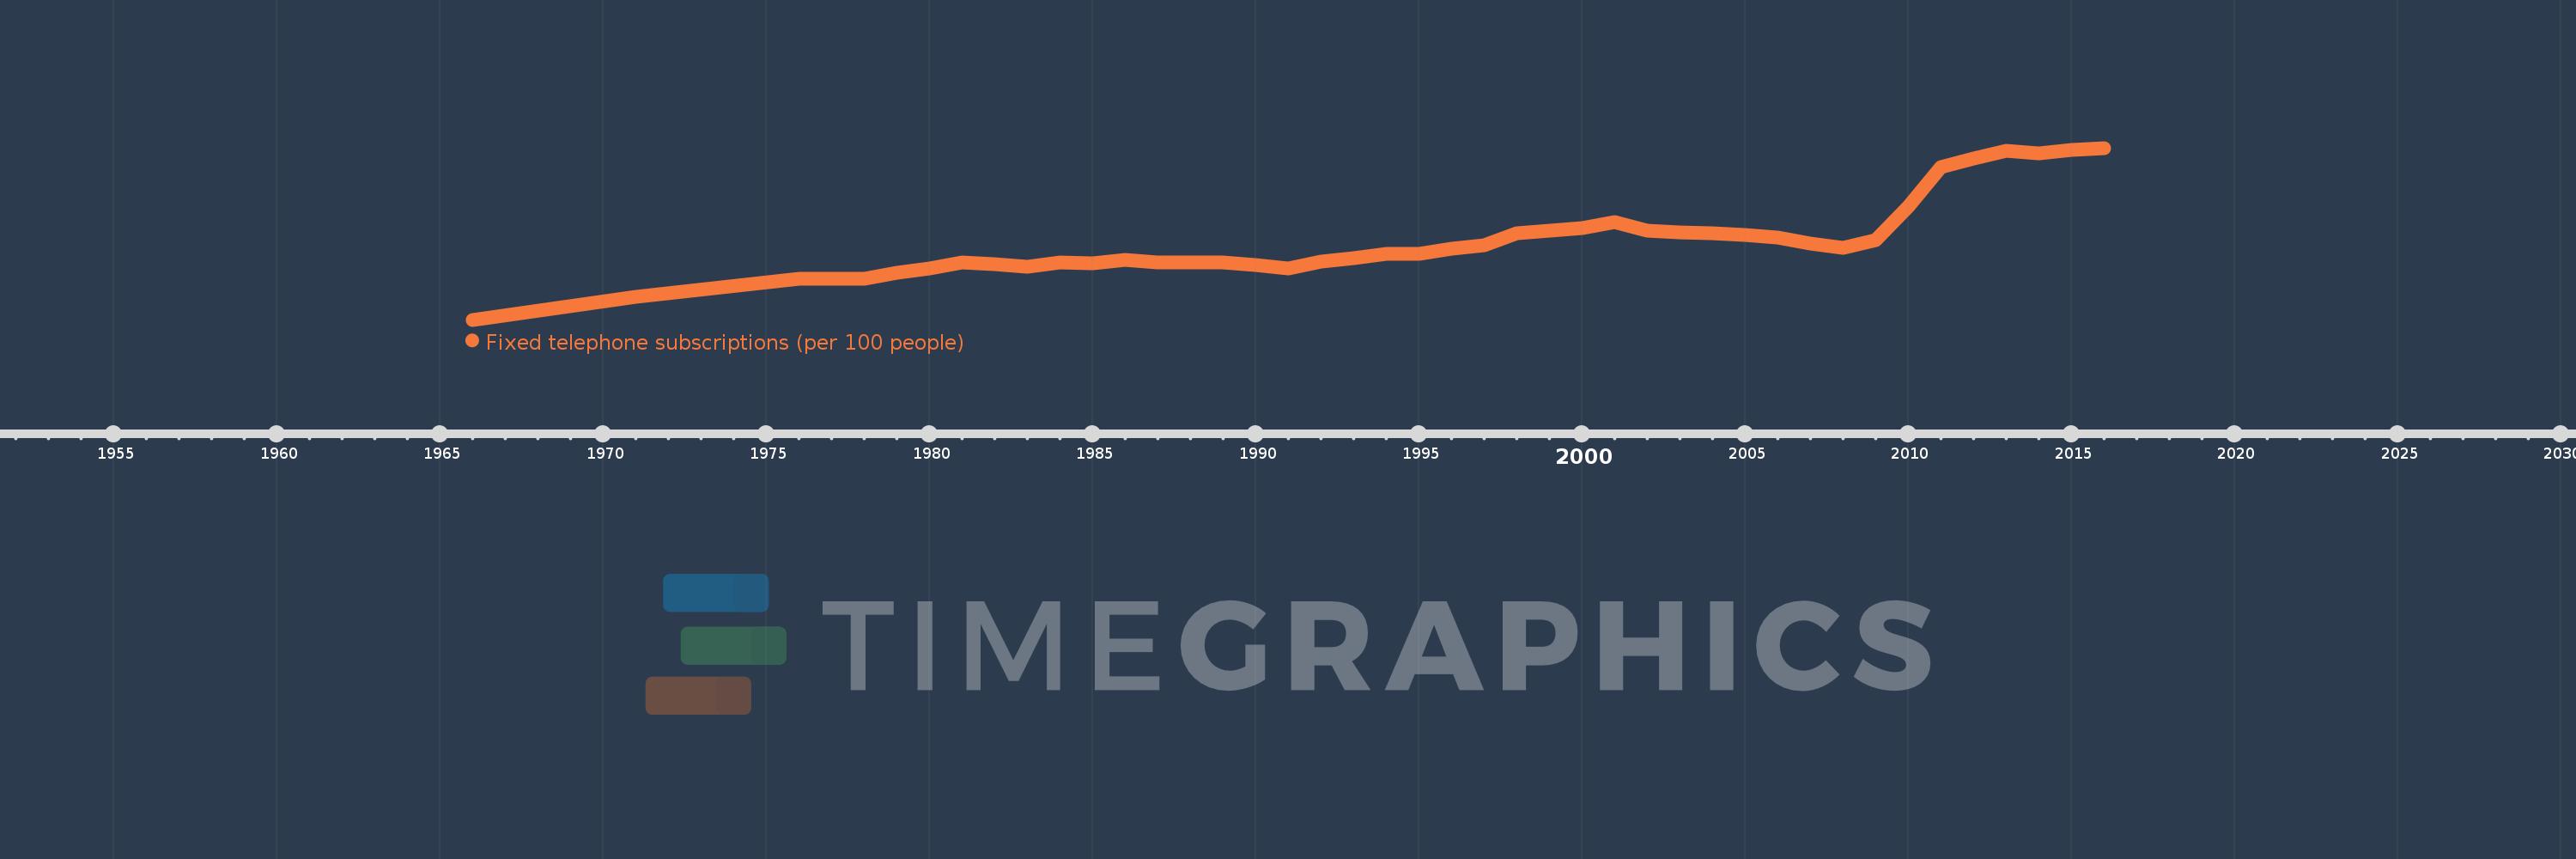
Fixed telephone subscriptions (per 100 people)
2016,2015,2014,2013,2012,2011,2010,2009,2008,2007,2006,2005,2004,2003,2002,2001,2000,1999,1998,1997,1996,1995,1994,1993,1992,1991,1990,1989,1988,1987,1986,1985,1984,1983,1982,1981,1980,1979,1978,1977,1976,1971,1966
This statistics in other country:
AfghanistanAlbaniaAlgeriaAmerican SamoaAndorraAngolaAntigua and BarbudaArab WorldArgentinaArmeniaArubaAustraliaAustriaAzerbaijanBahamas, TheBahrainBangladeshBarbadosBelarusBelgiumBelizeBeninBermudaBhutanBoliviaBosnia and HerzegovinaBotswanaBrazilBritish Virgin IslandsBrunei DarussalamBulgariaBurkina FasoBurundiCabo VerdeCambodiaCameroonCanadaCaribbean small statesCayman IslandsCentral African RepublicCentral Europe and the BalticsChadChileChinaColombiaComorosCongo, Dem. Rep.Congo, Rep.Costa RicaCote d'IvoireCroatiaCubaCuracaoCyprusCzech RepublicDenmarkDjiboutiDominicaDominican RepublicEarly-demographic dividendEast Asia & PacificEast Asia & Pacific (excluding high income)East Asia & Pacific (IDA & IBRD countries)EcuadorEgypt, Arab Rep.El SalvadorEquatorial GuineaEritreaEstoniaEthiopiaEuro areaEurope & Central AsiaEurope & Central Asia (excluding high income)Europe & Central Asia (IDA & IBRD countries)European UnionFaroe IslandsFijiFinlandFragile and conflict affected situationsFranceFrench PolynesiaGabonGambia, TheGeorgiaGermanyGhanaGibraltarGreeceGreenlandGrenadaGuamGuatemalaGuineaGuinea-BissauGuyanaHaitiHeavily indebted poor countries (HIPC)High incomeHondurasHong Kong SAR, ChinaHungaryIBRD onlyIcelandIDA & IBRD totalIDA blendIDA onlyIDA totalIndiaIndonesiaIran, Islamic Rep.IraqIrelandIsraelItalyJamaicaJapanJordanKazakhstanKenyaKiribatiKorea, Dem. People’s Rep.Korea, Rep.KosovoKuwaitKyrgyz RepublicLao PDRLate-demographic dividendLatin America & Caribbean Latin America & Caribbean (excluding high income)Latin America & the Caribbean (IDA & IBRD countries)LatviaLeast developed countries: UN classificationLebanonLesothoLiberiaLibyaLiechtensteinLithuaniaLow & middle incomeLow incomeLower middle incomeLuxembourgMacao SAR, ChinaMacedonia, FYRMadagascarMalawiMalaysiaMaldivesMaliMaltaMarshall IslandsMauritaniaMauritiusMexicoMicronesia, Fed. Sts.Middle East & North AfricaMiddle East & North Africa (excluding high income)Middle East & North Africa (IDA & IBRD countries)Middle incomeMoldovaMonacoMongoliaMontenegroMoroccoMozambiqueMyanmarNamibiaNauruNepalNetherlandsNew CaledoniaNew ZealandNicaraguaNigerNigeriaNorth AmericaNorthern Mariana IslandsNorwayOECD membersOmanOther small statesPacific island small statesPakistanPalauPanamaPapua New GuineaParaguayPeruPhilippinesPolandPortugalPost-demographic dividendPre-demographic dividendPuerto RicoQatarRomaniaRussian FederationRwandaSamoaSan MarinoSao Tome and PrincipeSaudi ArabiaSenegalSerbiaSeychellesSierra LeoneSingaporeSlovak RepublicSloveniaSmall statesSolomon IslandsSomaliaSouth AfricaSouth AsiaSouth Asia (IDA & IBRD)South SudanSpainSri LankaSt. Kitts and NevisSt. LuciaSt. Vincent and the GrenadinesSub-Saharan Africa Sub-Saharan Africa (excluding high income)Sub-Saharan Africa (IDA & IBRD countries)SudanSurinameSwazilandSwedenSwitzerlandSyrian Arab RepublicTajikistanTanzaniaThailandTimor-LesteTogoTongaTrinidad and TobagoTunisiaTurkeyTurkmenistanTurks and Caicos IslandsTuvaluUgandaUkraineUnited Arab EmiratesUnited KingdomUnited StatesUpper middle incomeUruguayUzbekistanVanuatuVenezuela, RBVietnamVirgin Islands (U.S.)West Bank and GazaWorldYemen, Rep.ZambiaZimbabwe Timeline:
This timeline shows a graph from 1966 to 2016 of Papua New Guinea. No data until 1965. Number of actual observations by date: 43.
Source name:
World Development Indicators
Source organization:
International Telecommunication Union, World Telecommunication/ICT Development Report and database.
Categories, topics:
Infrastructure
Last updated:
apr 23, 2017
Indicators value changes by year
At the date of observation
Value
Absolute change
Change from previous value
jan 1, 1966
0.197
+0.197
0.0%
jan 1, 1971
0.431
+0.234
118.62%
jan 1, 1976
0.623
+0.192
44.43%
jan 1, 1977
0.616
-0.007
-1.06%
jan 1, 1978
0.62
+0.004
0.62%
jan 1, 1979
0.679
+0.059
9.54%
jan 1, 1980
0.728
+0.049
7.25%
jan 1, 1981
0.791
+0.062
8.54%
jan 1, 1982
0.773
-0.017
-2.18%
jan 1, 1983
0.743
-0.03
-3.92%
jan 1, 1984
0.79
+0.047
6.33%
jan 1, 1985
0.782
-0.009
-1.08%
jan 1, 1986
0.816
+0.034
4.37%
jan 1, 1987
0.789
-0.027
-3.34%
jan 1, 1988
0.787
-0.001
-0.17%
jan 1, 1989
0.783
-0.005
-0.58%
jan 1, 1990
0.764
-0.019
-2.4%
jan 1, 1991
0.726
-0.038
-4.95%
jan 1, 1992
0.795
+0.069
9.48%
jan 1, 1993
0.835
+0.04
5.0%
jan 1, 1994
0.878
+0.043
5.16%
jan 1, 1995
0.871
-0.007
-0.79%
jan 1, 1996
0.926
+0.055
6.29%
jan 1, 1997
0.967
+0.041
4.44%
jan 1, 1998
1.088
+0.121
12.56%
jan 1, 1999
1.115
+0.027
2.51%
jan 1, 2000
1.141
+0.025
2.25%
jan 1, 2001
1.205
+0.065
5.68%
jan 1, 2002
1.116
-0.089
-7.38%
jan 1, 2003
1.096
-0.02
-1.79%
jan 1, 2004
1.084
-0.013
-1.17%
jan 1, 2005
1.067
-0.017
-1.55%
jan 1, 2006
1.045
-0.021
-2.01%
jan 1, 2007
0.985
-0.061
-5.8%
jan 1, 2008
0.938
-0.047
-4.75%
jan 1, 2009
1.02
+0.083
8.8%
jan 1, 2010
1.359
+0.339
33.19%
jan 1, 2011
1.767
+0.408
29.99%
jan 1, 2012
1.854
+0.087
4.93%
jan 1, 2013
1.939
+0.086
4.63%
jan 1, 2014
1.912
-0.027
-1.4%
jan 1, 2015
1.941
+0.029
1.5%
jan 1, 2016
1.965
+0.025
1.27%
Ranking of countries by current statistics by years


Comments: