29
/
en
AIzaSyAYiBZKx7MnpbEhh9jyipgxe19OcubqV5w
April 1, 2024
76143
Bahamas, The
BHS
true
2
1
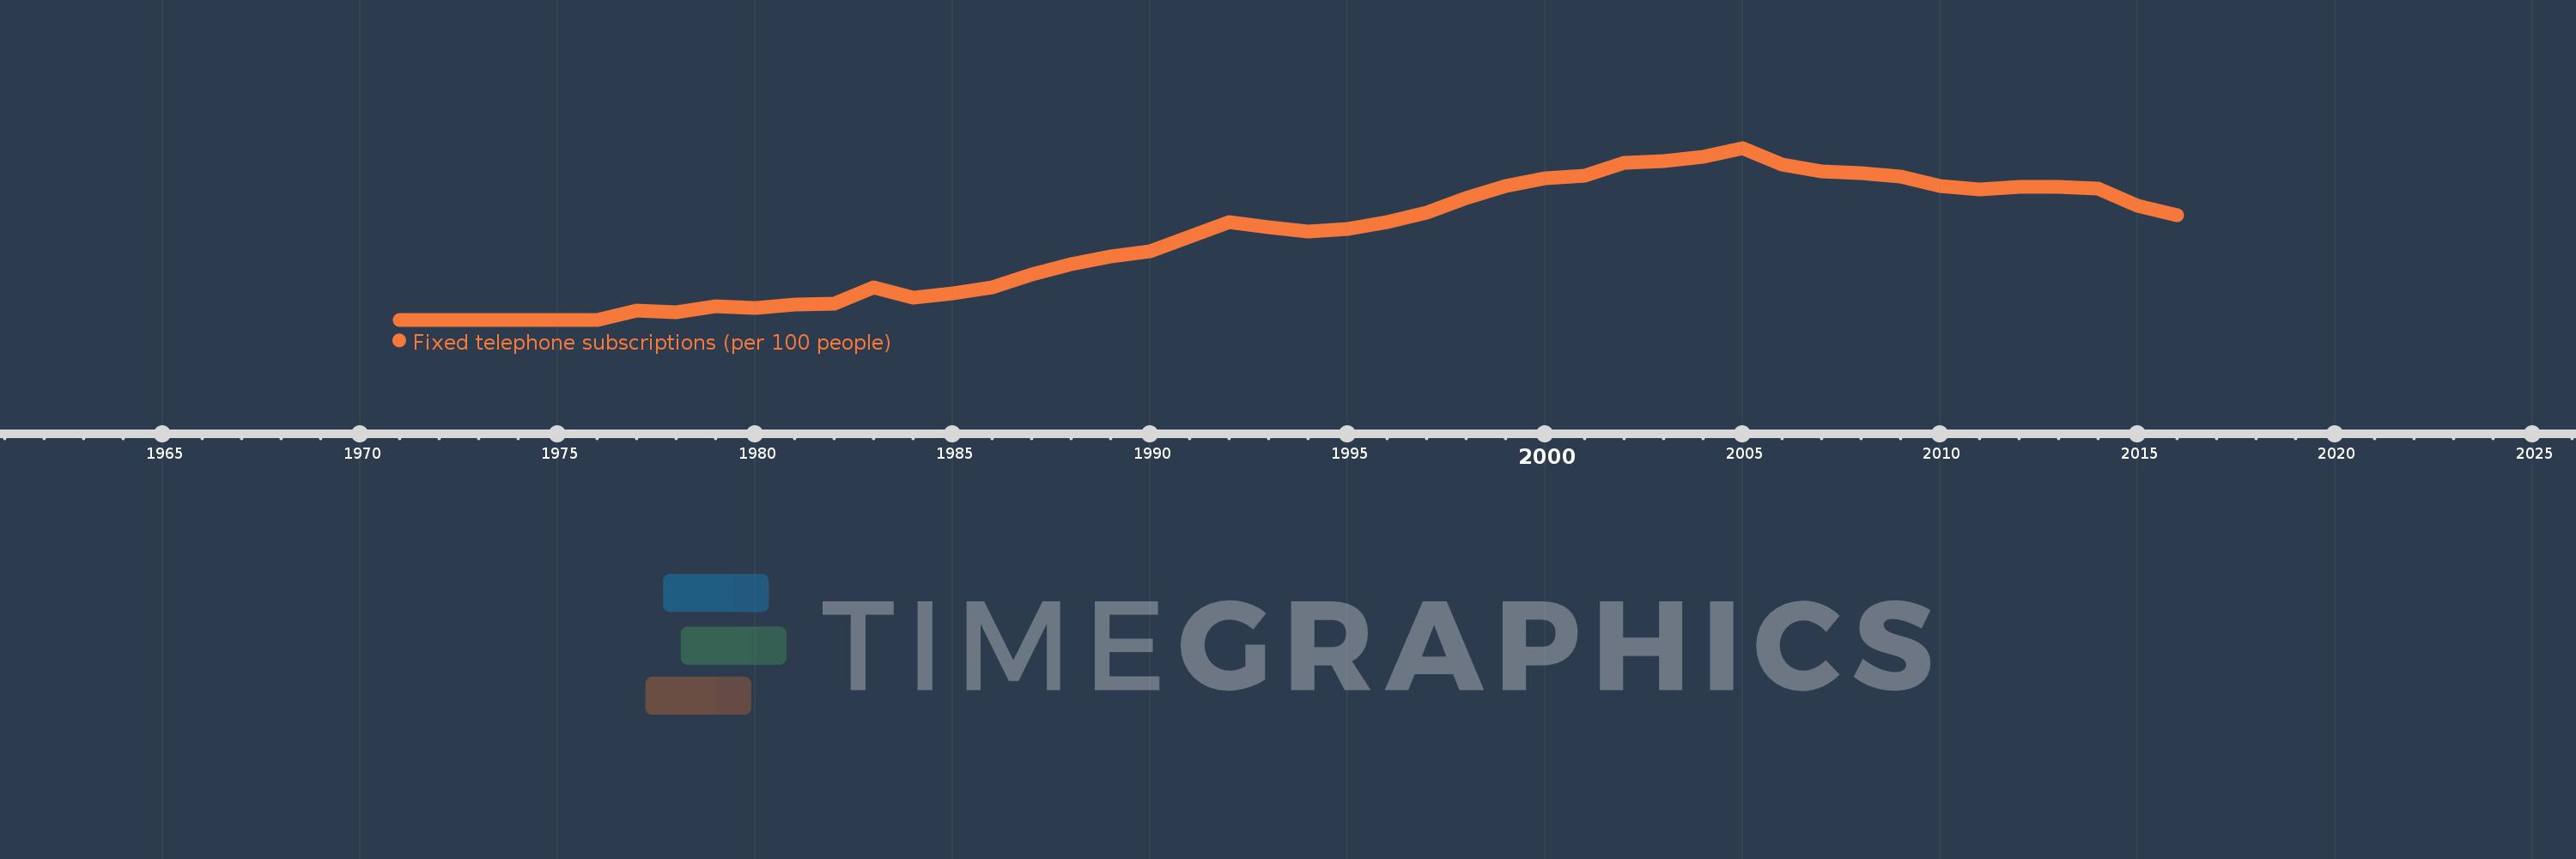
Fixed telephone subscriptions (per 100 people)
2016,2015,2014,2013,2012,2011,2010,2009,2008,2007,2006,2005,2004,2003,2002,2001,2000,1999,1998,1997,1996,1995,1994,1993,1992,1991,1990,1989,1988,1987,1986,1985,1984,1983,1982,1981,1980,1979,1978,1977,1976,1971
This statistics in other country:
AfghanistanAlbaniaAlgeriaAmerican SamoaAndorraAngolaAntigua and BarbudaArab WorldArgentinaArmeniaArubaAustraliaAustriaAzerbaijanBahamas, TheBahrainBangladeshBarbadosBelarusBelgiumBelizeBeninBermudaBhutanBoliviaBosnia and HerzegovinaBotswanaBrazilBritish Virgin IslandsBrunei DarussalamBulgariaBurkina FasoBurundiCabo VerdeCambodiaCameroonCanadaCaribbean small statesCayman IslandsCentral African RepublicCentral Europe and the BalticsChadChileChinaColombiaComorosCongo, Dem. Rep.Congo, Rep.Costa RicaCote d'IvoireCroatiaCubaCuracaoCyprusCzech RepublicDenmarkDjiboutiDominicaDominican RepublicEarly-demographic dividendEast Asia & PacificEast Asia & Pacific (excluding high income)East Asia & Pacific (IDA & IBRD countries)EcuadorEgypt, Arab Rep.El SalvadorEquatorial GuineaEritreaEstoniaEthiopiaEuro areaEurope & Central AsiaEurope & Central Asia (excluding high income)Europe & Central Asia (IDA & IBRD countries)European UnionFaroe IslandsFijiFinlandFragile and conflict affected situationsFranceFrench PolynesiaGabonGambia, TheGeorgiaGermanyGhanaGibraltarGreeceGreenlandGrenadaGuamGuatemalaGuineaGuinea-BissauGuyanaHaitiHeavily indebted poor countries (HIPC)High incomeHondurasHong Kong SAR, ChinaHungaryIBRD onlyIcelandIDA & IBRD totalIDA blendIDA onlyIDA totalIndiaIndonesiaIran, Islamic Rep.IraqIrelandIsraelItalyJamaicaJapanJordanKazakhstanKenyaKiribatiKorea, Dem. People’s Rep.Korea, Rep.KosovoKuwaitKyrgyz RepublicLao PDRLate-demographic dividendLatin America & Caribbean Latin America & Caribbean (excluding high income)Latin America & the Caribbean (IDA & IBRD countries)LatviaLeast developed countries: UN classificationLebanonLesothoLiberiaLibyaLiechtensteinLithuaniaLow & middle incomeLow incomeLower middle incomeLuxembourgMacao SAR, ChinaMacedonia, FYRMadagascarMalawiMalaysiaMaldivesMaliMaltaMarshall IslandsMauritaniaMauritiusMexicoMicronesia, Fed. Sts.Middle East & North AfricaMiddle East & North Africa (excluding high income)Middle East & North Africa (IDA & IBRD countries)Middle incomeMoldovaMonacoMongoliaMontenegroMoroccoMozambiqueMyanmarNamibiaNauruNepalNetherlandsNew CaledoniaNew ZealandNicaraguaNigerNigeriaNorth AmericaNorthern Mariana IslandsNorwayOECD membersOmanOther small statesPacific island small statesPakistanPalauPanamaPapua New GuineaParaguayPeruPhilippinesPolandPortugalPost-demographic dividendPre-demographic dividendPuerto RicoQatarRomaniaRussian FederationRwandaSamoaSan MarinoSao Tome and PrincipeSaudi ArabiaSenegalSerbiaSeychellesSierra LeoneSingaporeSlovak RepublicSloveniaSmall statesSolomon IslandsSomaliaSouth AfricaSouth AsiaSouth Asia (IDA & IBRD)South SudanSpainSri LankaSt. Kitts and NevisSt. LuciaSt. Vincent and the GrenadinesSub-Saharan Africa Sub-Saharan Africa (excluding high income)Sub-Saharan Africa (IDA & IBRD countries)SudanSurinameSwazilandSwedenSwitzerlandSyrian Arab RepublicTajikistanTanzaniaThailandTimor-LesteTogoTongaTrinidad and TobagoTunisiaTurkeyTurkmenistanTurks and Caicos IslandsTuvaluUgandaUkraineUnited Arab EmiratesUnited KingdomUnited StatesUpper middle incomeUruguayUzbekistanVanuatuVenezuela, RBVietnamVirgin Islands (U.S.)West Bank and GazaWorldYemen, Rep.ZambiaZimbabwe Timeline:
This timeline shows a graph from 1971 to 2016 of Bahamas, The. No data until 1970. Number of actual observations by date: 42.
Source name:
World Development Indicators
Source organization:
International Telecommunication Union, World Telecommunication/ICT Development Report and database.
Categories, topics:
Infrastructure
Last updated:
apr 23, 2017
Indicators value changes by year
Minimum:
12.046
jan 1, 1971
Maximum:
43.404
jan 1, 2005
At the date of observation
Value
Absolute change
Change from previous value
jan 1, 1971
12.046
+12.046
0.0%
jan 1, 1976
12.071
+0.025
0.21%
jan 1, 1977
13.685
+1.614
13.37%
jan 1, 1978
13.444
-0.242
-1.77%
jan 1, 1979
14.491
+1.047
7.79%
jan 1, 1980
14.124
-0.367
-2.53%
jan 1, 1981
14.754
+0.63
4.46%
jan 1, 1982
14.967
+0.214
1.45%
jan 1, 1983
18.032
+3.065
20.48%
jan 1, 1984
16.109
-1.923
-10.66%
jan 1, 1985
16.87
+0.761
4.72%
jan 1, 1986
17.89
+1.021
6.05%
jan 1, 1987
20.253
+2.363
13.21%
jan 1, 1988
22.141
+1.888
9.32%
jan 1, 1989
23.588
+1.447
6.53%
jan 1, 1990
24.558
+0.97
4.11%
jan 1, 1991
27.258
+2.7
10.99%
jan 1, 1992
29.935
+2.677
9.82%
jan 1, 1993
28.864
-1.071
-3.58%
jan 1, 1994
28.1
-0.764
-2.65%
jan 1, 1995
28.582
+0.483
1.72%
jan 1, 1996
29.89
+1.308
4.57%
jan 1, 1997
31.537
+1.647
5.51%
jan 1, 1998
34.208
+2.672
8.47%
jan 1, 1999
36.516
+2.307
6.75%
jan 1, 2000
37.89
+1.374
3.76%
jan 1, 2001
38.403
+0.513
1.35%
jan 1, 2002
40.693
+2.291
5.96%
jan 1, 2003
40.951
+0.258
0.64%
jan 1, 2004
41.776
+0.825
2.01%
jan 1, 2005
43.404
+1.628
3.9%
jan 1, 2006
40.437
-2.967
-6.84%
jan 1, 2007
39.2
-1.237
-3.06%
jan 1, 2008
38.841
-0.359
-0.92%
jan 1, 2009
38.111
-0.73
-1.88%
jan 1, 2010
36.38
-1.731
-4.54%
jan 1, 2011
35.871
-0.509
-1.4%
jan 1, 2012
36.305
+0.434
1.21%
jan 1, 2013
36.294
-0.01
-0.03%
jan 1, 2014
36.039
-0.256
-0.7%
jan 1, 2015
32.846
-3.193
-8.86%
jan 1, 2016
31.203
-1.643
-5.0%
Ranking of countries by current statistics by years


Comments: