29
/
en
AIzaSyAYiBZKx7MnpbEhh9jyipgxe19OcubqV5w
April 1, 2024
163732
Japan
JPN
true
2
1
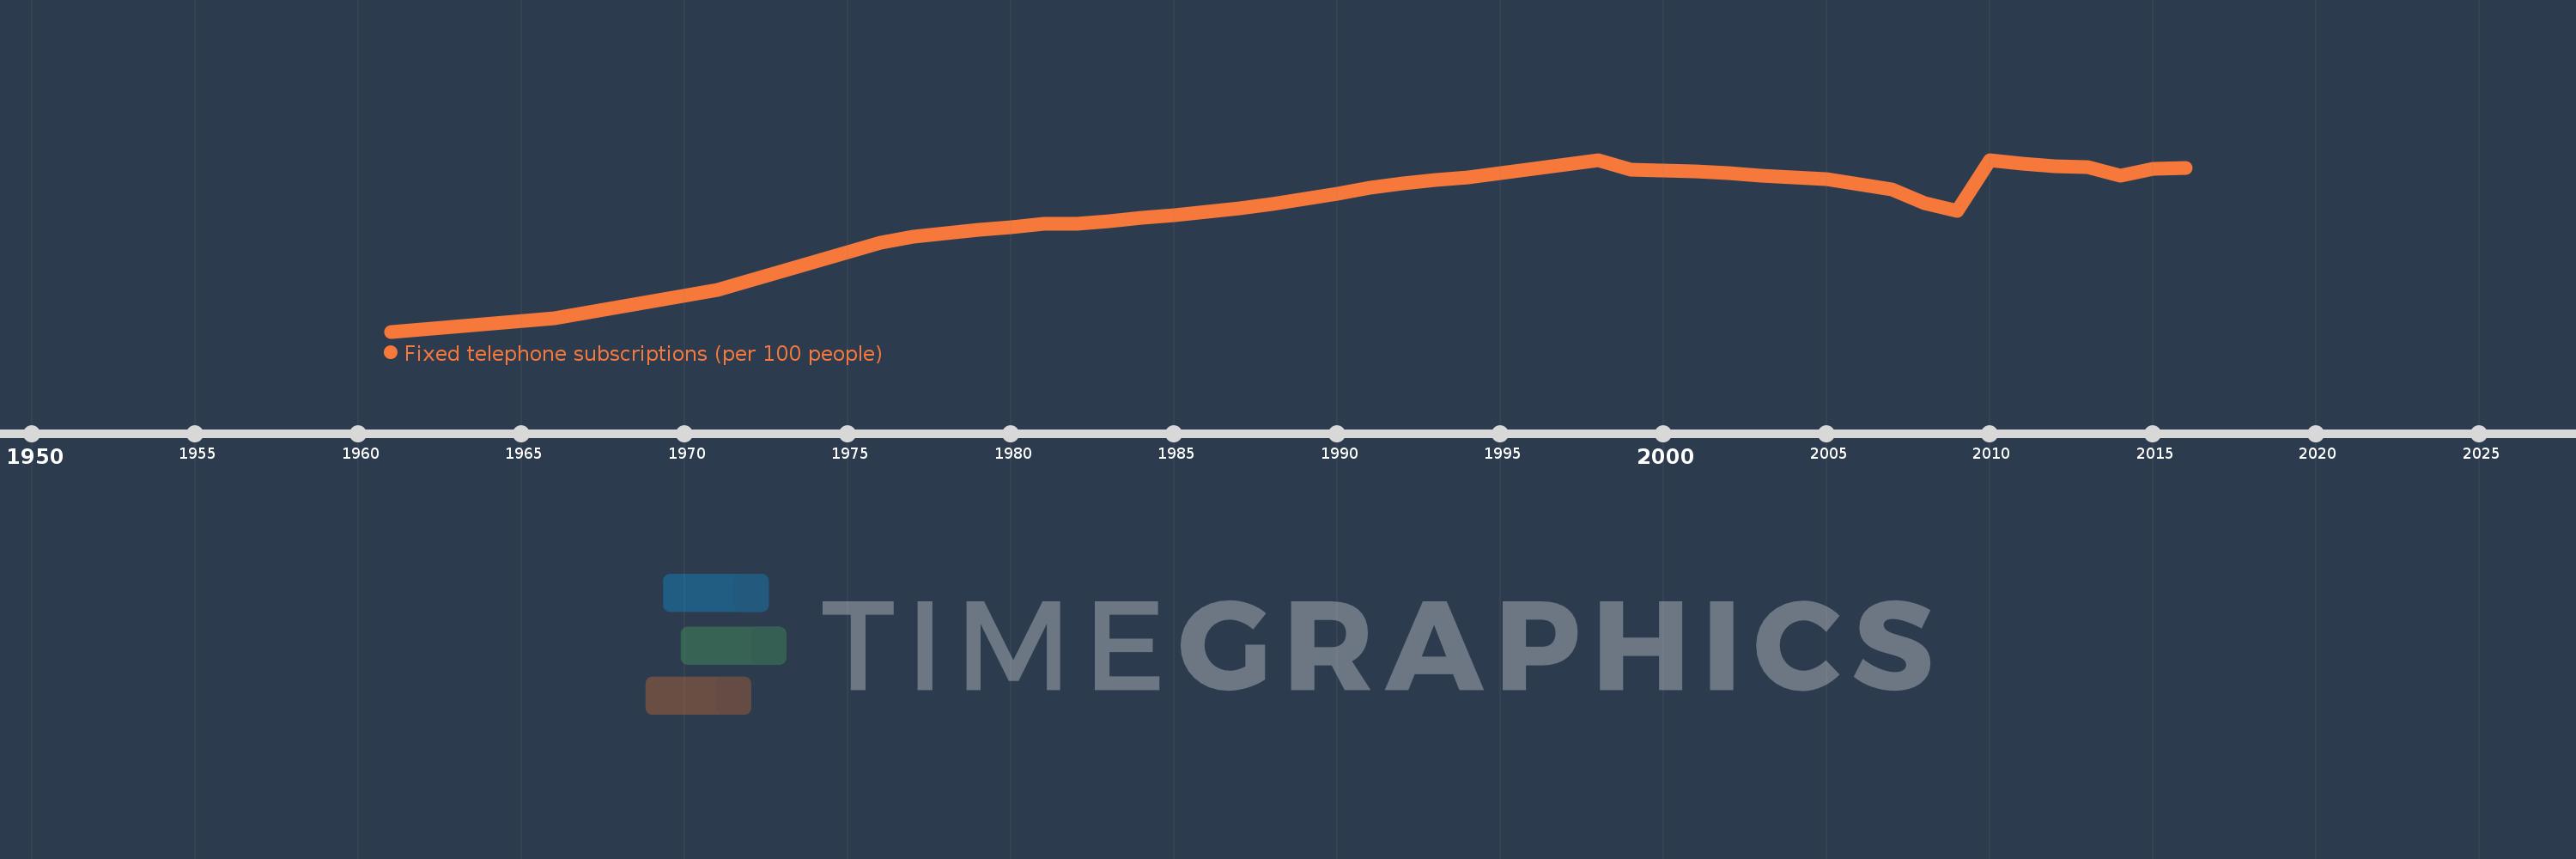
Fixed telephone subscriptions (per 100 people)
2016,2015,2014,2013,2012,2011,2010,2009,2008,2007,2006,2005,2004,2003,2002,2001,2000,1999,1998,1997,1996,1995,1994,1993,1992,1991,1990,1989,1988,1987,1986,1985,1984,1983,1982,1981,1980,1979,1978,1977,1976,1971,1966,1961
This statistics in other country:
AfghanistanAlbaniaAlgeriaAmerican SamoaAndorraAngolaAntigua and BarbudaArab WorldArgentinaArmeniaArubaAustraliaAustriaAzerbaijanBahamas, TheBahrainBangladeshBarbadosBelarusBelgiumBelizeBeninBermudaBhutanBoliviaBosnia and HerzegovinaBotswanaBrazilBritish Virgin IslandsBrunei DarussalamBulgariaBurkina FasoBurundiCabo VerdeCambodiaCameroonCanadaCaribbean small statesCayman IslandsCentral African RepublicCentral Europe and the BalticsChadChileChinaColombiaComorosCongo, Dem. Rep.Congo, Rep.Costa RicaCote d'IvoireCroatiaCubaCuracaoCyprusCzech RepublicDenmarkDjiboutiDominicaDominican RepublicEarly-demographic dividendEast Asia & PacificEast Asia & Pacific (excluding high income)East Asia & Pacific (IDA & IBRD countries)EcuadorEgypt, Arab Rep.El SalvadorEquatorial GuineaEritreaEstoniaEthiopiaEuro areaEurope & Central AsiaEurope & Central Asia (excluding high income)Europe & Central Asia (IDA & IBRD countries)European UnionFaroe IslandsFijiFinlandFragile and conflict affected situationsFranceFrench PolynesiaGabonGambia, TheGeorgiaGermanyGhanaGibraltarGreeceGreenlandGrenadaGuamGuatemalaGuineaGuinea-BissauGuyanaHaitiHeavily indebted poor countries (HIPC)High incomeHondurasHong Kong SAR, ChinaHungaryIBRD onlyIcelandIDA & IBRD totalIDA blendIDA onlyIDA totalIndiaIndonesiaIran, Islamic Rep.IraqIrelandIsraelItalyJamaicaJapanJordanKazakhstanKenyaKiribatiKorea, Dem. People’s Rep.Korea, Rep.KosovoKuwaitKyrgyz RepublicLao PDRLate-demographic dividendLatin America & Caribbean Latin America & Caribbean (excluding high income)Latin America & the Caribbean (IDA & IBRD countries)LatviaLeast developed countries: UN classificationLebanonLesothoLiberiaLibyaLiechtensteinLithuaniaLow & middle incomeLow incomeLower middle incomeLuxembourgMacao SAR, ChinaMacedonia, FYRMadagascarMalawiMalaysiaMaldivesMaliMaltaMarshall IslandsMauritaniaMauritiusMexicoMicronesia, Fed. Sts.Middle East & North AfricaMiddle East & North Africa (excluding high income)Middle East & North Africa (IDA & IBRD countries)Middle incomeMoldovaMonacoMongoliaMontenegroMoroccoMozambiqueMyanmarNamibiaNauruNepalNetherlandsNew CaledoniaNew ZealandNicaraguaNigerNigeriaNorth AmericaNorthern Mariana IslandsNorwayOECD membersOmanOther small statesPacific island small statesPakistanPalauPanamaPapua New GuineaParaguayPeruPhilippinesPolandPortugalPost-demographic dividendPre-demographic dividendPuerto RicoQatarRomaniaRussian FederationRwandaSamoaSan MarinoSao Tome and PrincipeSaudi ArabiaSenegalSerbiaSeychellesSierra LeoneSingaporeSlovak RepublicSloveniaSmall statesSolomon IslandsSomaliaSouth AfricaSouth AsiaSouth Asia (IDA & IBRD)South SudanSpainSri LankaSt. Kitts and NevisSt. LuciaSt. Vincent and the GrenadinesSub-Saharan Africa Sub-Saharan Africa (excluding high income)Sub-Saharan Africa (IDA & IBRD countries)SudanSurinameSwazilandSwedenSwitzerlandSyrian Arab RepublicTajikistanTanzaniaThailandTimor-LesteTogoTongaTrinidad and TobagoTunisiaTurkeyTurkmenistanTurks and Caicos IslandsTuvaluUgandaUkraineUnited Arab EmiratesUnited KingdomUnited StatesUpper middle incomeUruguayUzbekistanVanuatuVenezuela, RBVietnamVirgin Islands (U.S.)West Bank and GazaWorldYemen, Rep.ZambiaZimbabwe Timeline:
This timeline shows a graph from 1961 to 2016 of Japan. No data until 1960. Number of actual observations by date: 44.
Source name:
World Development Indicators
Source organization:
International Telecommunication Union, World Telecommunication/ICT Development Report and database.
Categories, topics:
Infrastructure
Last updated:
apr 23, 2017
Indicators value changes by year
Maximum:
52.568
jan 1, 1998
At the date of observation
Value
Absolute change
Change from previous value
jan 1, 1961
3.927
+3.927
0.0%
jan 1, 1966
7.601
+3.674
93.54%
jan 1, 1971
15.817
+8.216
108.08%
jan 1, 1976
29.22
+13.403
84.74%
jan 1, 1977
30.756
+1.536
5.26%
jan 1, 1978
31.695
+0.94
3.06%
jan 1, 1979
32.628
+0.933
2.94%
jan 1, 1980
33.577
+0.949
2.91%
jan 1, 1981
34.452
+0.875
2.61%
jan 1, 1982
34.476
+0.024
0.07%
jan 1, 1983
35.257
+0.781
2.26%
jan 1, 1984
36.169
+0.912
2.59%
jan 1, 1985
36.841
+0.672
1.86%
jan 1, 1986
37.753
+0.912
2.48%
jan 1, 1987
38.798
+1.045
2.77%
jan 1, 1988
40.009
+1.21
3.12%
jan 1, 1989
41.455
+1.446
3.61%
jan 1, 1990
43.054
+1.6
3.86%
jan 1, 1991
44.604
+1.55
3.6%
jan 1, 1992
45.851
+1.247
2.8%
jan 1, 1993
46.803
+0.953
2.08%
jan 1, 1994
47.574
+0.771
1.65%
jan 1, 1995
48.904
+1.329
2.79%
jan 1, 1996
50.04
+1.137
2.32%
jan 1, 1997
51.314
+1.273
2.54%
jan 1, 1998
52.568
+1.254
2.44%
jan 1, 1999
49.824
-2.743
-5.22%
jan 1, 2000
49.452
-0.372
-0.75%
jan 1, 2001
49.284
-0.168
-0.34%
jan 1, 2002
48.681
-0.603
-1.22%
jan 1, 2003
48.137
-0.544
-1.12%
jan 1, 2004
47.595
-0.542
-1.13%
jan 1, 2005
47.02
-0.576
-1.21%
jan 1, 2006
45.719
-1.301
-2.77%
jan 1, 2007
44.07
-1.649
-3.61%
jan 1, 2008
40.264
-3.806
-8.64%
jan 1, 2009
38.036
-2.228
-5.53%
jan 1, 2010
52.448
+14.412
37.89%
jan 1, 2011
51.525
-0.923
-1.76%
jan 1, 2012
50.792
-0.733
-1.42%
jan 1, 2013
50.472
-0.321
-0.63%
jan 1, 2014
47.992
-2.48
-4.91%
jan 1, 2015
50.087
+2.095
4.36%
jan 1, 2016
50.177
+0.09
0.18%
Ranking of countries by current statistics by years


Comments: