29
/
en
AIzaSyAYiBZKx7MnpbEhh9jyipgxe19OcubqV5w
April 1, 2024
181074
Lithuania
LTU
true
2
1
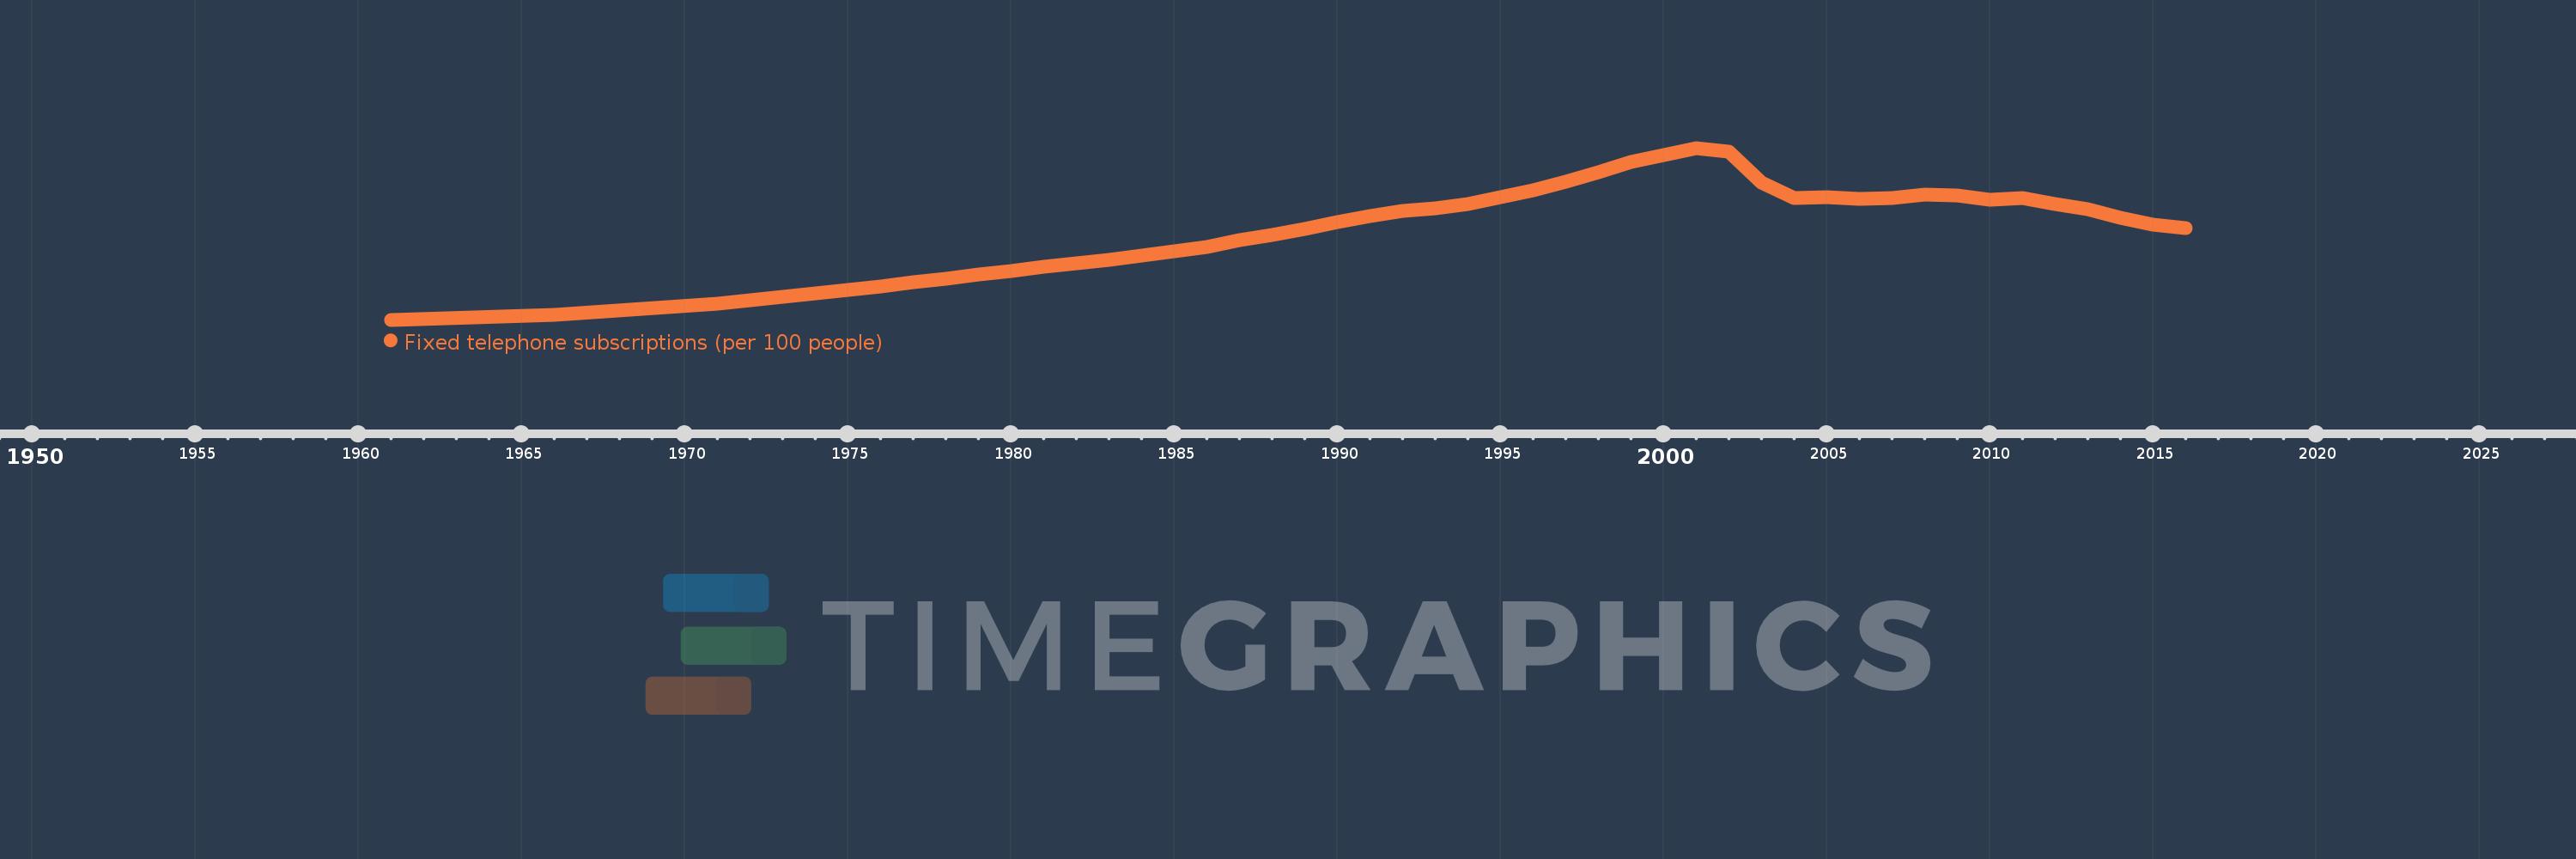
Fixed telephone subscriptions (per 100 people)
2016,2015,2014,2013,2012,2011,2010,2009,2008,2007,2006,2005,2004,2003,2002,2001,2000,1999,1998,1997,1996,1995,1994,1993,1992,1991,1990,1989,1988,1987,1986,1985,1984,1983,1982,1981,1980,1979,1978,1977,1976,1971,1966,1961
This statistics in other country:
AfghanistanAlbaniaAlgeriaAmerican SamoaAndorraAngolaAntigua and BarbudaArab WorldArgentinaArmeniaArubaAustraliaAustriaAzerbaijanBahamas, TheBahrainBangladeshBarbadosBelarusBelgiumBelizeBeninBermudaBhutanBoliviaBosnia and HerzegovinaBotswanaBrazilBritish Virgin IslandsBrunei DarussalamBulgariaBurkina FasoBurundiCabo VerdeCambodiaCameroonCanadaCaribbean small statesCayman IslandsCentral African RepublicCentral Europe and the BalticsChadChileChinaColombiaComorosCongo, Dem. Rep.Congo, Rep.Costa RicaCote d'IvoireCroatiaCubaCuracaoCyprusCzech RepublicDenmarkDjiboutiDominicaDominican RepublicEarly-demographic dividendEast Asia & PacificEast Asia & Pacific (excluding high income)East Asia & Pacific (IDA & IBRD countries)EcuadorEgypt, Arab Rep.El SalvadorEquatorial GuineaEritreaEstoniaEthiopiaEuro areaEurope & Central AsiaEurope & Central Asia (excluding high income)Europe & Central Asia (IDA & IBRD countries)European UnionFaroe IslandsFijiFinlandFragile and conflict affected situationsFranceFrench PolynesiaGabonGambia, TheGeorgiaGermanyGhanaGibraltarGreeceGreenlandGrenadaGuamGuatemalaGuineaGuinea-BissauGuyanaHaitiHeavily indebted poor countries (HIPC)High incomeHondurasHong Kong SAR, ChinaHungaryIBRD onlyIcelandIDA & IBRD totalIDA blendIDA onlyIDA totalIndiaIndonesiaIran, Islamic Rep.IraqIrelandIsraelItalyJamaicaJapanJordanKazakhstanKenyaKiribatiKorea, Dem. People’s Rep.Korea, Rep.KosovoKuwaitKyrgyz RepublicLao PDRLate-demographic dividendLatin America & Caribbean Latin America & Caribbean (excluding high income)Latin America & the Caribbean (IDA & IBRD countries)LatviaLeast developed countries: UN classificationLebanonLesothoLiberiaLibyaLiechtensteinLithuaniaLow & middle incomeLow incomeLower middle incomeLuxembourgMacao SAR, ChinaMacedonia, FYRMadagascarMalawiMalaysiaMaldivesMaliMaltaMarshall IslandsMauritaniaMauritiusMexicoMicronesia, Fed. Sts.Middle East & North AfricaMiddle East & North Africa (excluding high income)Middle East & North Africa (IDA & IBRD countries)Middle incomeMoldovaMonacoMongoliaMontenegroMoroccoMozambiqueMyanmarNamibiaNauruNepalNetherlandsNew CaledoniaNew ZealandNicaraguaNigerNigeriaNorth AmericaNorthern Mariana IslandsNorwayOECD membersOmanOther small statesPacific island small statesPakistanPalauPanamaPapua New GuineaParaguayPeruPhilippinesPolandPortugalPost-demographic dividendPre-demographic dividendPuerto RicoQatarRomaniaRussian FederationRwandaSamoaSan MarinoSao Tome and PrincipeSaudi ArabiaSenegalSerbiaSeychellesSierra LeoneSingaporeSlovak RepublicSloveniaSmall statesSolomon IslandsSomaliaSouth AfricaSouth AsiaSouth Asia (IDA & IBRD)South SudanSpainSri LankaSt. Kitts and NevisSt. LuciaSt. Vincent and the GrenadinesSub-Saharan Africa Sub-Saharan Africa (excluding high income)Sub-Saharan Africa (IDA & IBRD countries)SudanSurinameSwazilandSwedenSwitzerlandSyrian Arab RepublicTajikistanTanzaniaThailandTimor-LesteTogoTongaTrinidad and TobagoTunisiaTurkeyTurkmenistanTurks and Caicos IslandsTuvaluUgandaUkraineUnited Arab EmiratesUnited KingdomUnited StatesUpper middle incomeUruguayUzbekistanVanuatuVenezuela, RBVietnamVirgin Islands (U.S.)West Bank and GazaWorldYemen, Rep.ZambiaZimbabwe Timeline:
This timeline shows a graph from 1961 to 2016 of Lithuania. No data until 1960. Number of actual observations by date: 44.
Source name:
World Development Indicators
Source organization:
International Telecommunication Union, World Telecommunication/ICT Development Report and database.
Categories, topics:
Infrastructure
Last updated:
apr 23, 2017
Indicators value changes by year
Maximum:
33.948
jan 1, 2001
At the date of observation
Value
Absolute change
Change from previous value
jan 1, 1961
1.458
+1.458
0.0%
jan 1, 1966
2.421
+0.964
66.11%
jan 1, 1971
4.565
+2.144
88.54%
jan 1, 1976
7.767
+3.201
70.13%
jan 1, 1977
8.527
+0.761
9.8%
jan 1, 1978
9.275
+0.748
8.77%
jan 1, 1979
9.985
+0.709
7.65%
jan 1, 1980
10.708
+0.723
7.24%
jan 1, 1981
11.48
+0.772
7.21%
jan 1, 1982
12.157
+0.677
5.9%
jan 1, 1983
12.851
+0.694
5.7%
jan 1, 1984
13.587
+0.736
5.73%
jan 1, 1985
14.414
+0.827
6.09%
jan 1, 1986
15.267
+0.853
5.92%
jan 1, 1987
16.497
+1.23
8.06%
jan 1, 1988
17.428
+0.931
5.64%
jan 1, 1989
18.603
+1.176
6.75%
jan 1, 1990
19.93
+1.327
7.13%
jan 1, 1991
21.122
+1.192
5.98%
jan 1, 1992
22.007
+0.885
4.19%
jan 1, 1993
22.559
+0.552
2.51%
jan 1, 1994
23.38
+0.82
3.64%
jan 1, 1995
24.59
+1.211
5.18%
jan 1, 1996
25.936
+1.346
5.47%
jan 1, 1997
27.527
+1.591
6.13%
jan 1, 1998
29.425
+1.898
6.89%
jan 1, 1999
31.271
+1.847
6.28%
jan 1, 2000
32.642
+1.371
4.39%
jan 1, 2001
33.948
+1.306
4.0%
jan 1, 2002
33.27
-0.678
-2.0%
jan 1, 2003
27.354
-5.916
-17.78%
jan 1, 2004
24.397
-2.957
-10.81%
jan 1, 2005
24.602
+0.205
0.84%
jan 1, 2006
24.374
-0.228
-0.93%
jan 1, 2007
24.464
+0.091
0.37%
jan 1, 2008
25.06
+0.596
2.43%
jan 1, 2009
24.972
-0.088
-0.35%
jan 1, 2010
24.095
-0.877
-3.51%
jan 1, 2011
24.554
+0.46
1.91%
jan 1, 2012
23.387
-1.167
-4.75%
jan 1, 2013
22.308
-1.08
-4.62%
jan 1, 2014
20.749
-1.559
-6.99%
jan 1, 2015
19.503
-1.247
-6.01%
jan 1, 2016
18.737
-0.766
-3.93%
Ranking of countries by current statistics by years


Comments: