29
/
en
AIzaSyAYiBZKx7MnpbEhh9jyipgxe19OcubqV5w
April 1, 2024
234616
Saudi Arabia
SAU
true
2
1
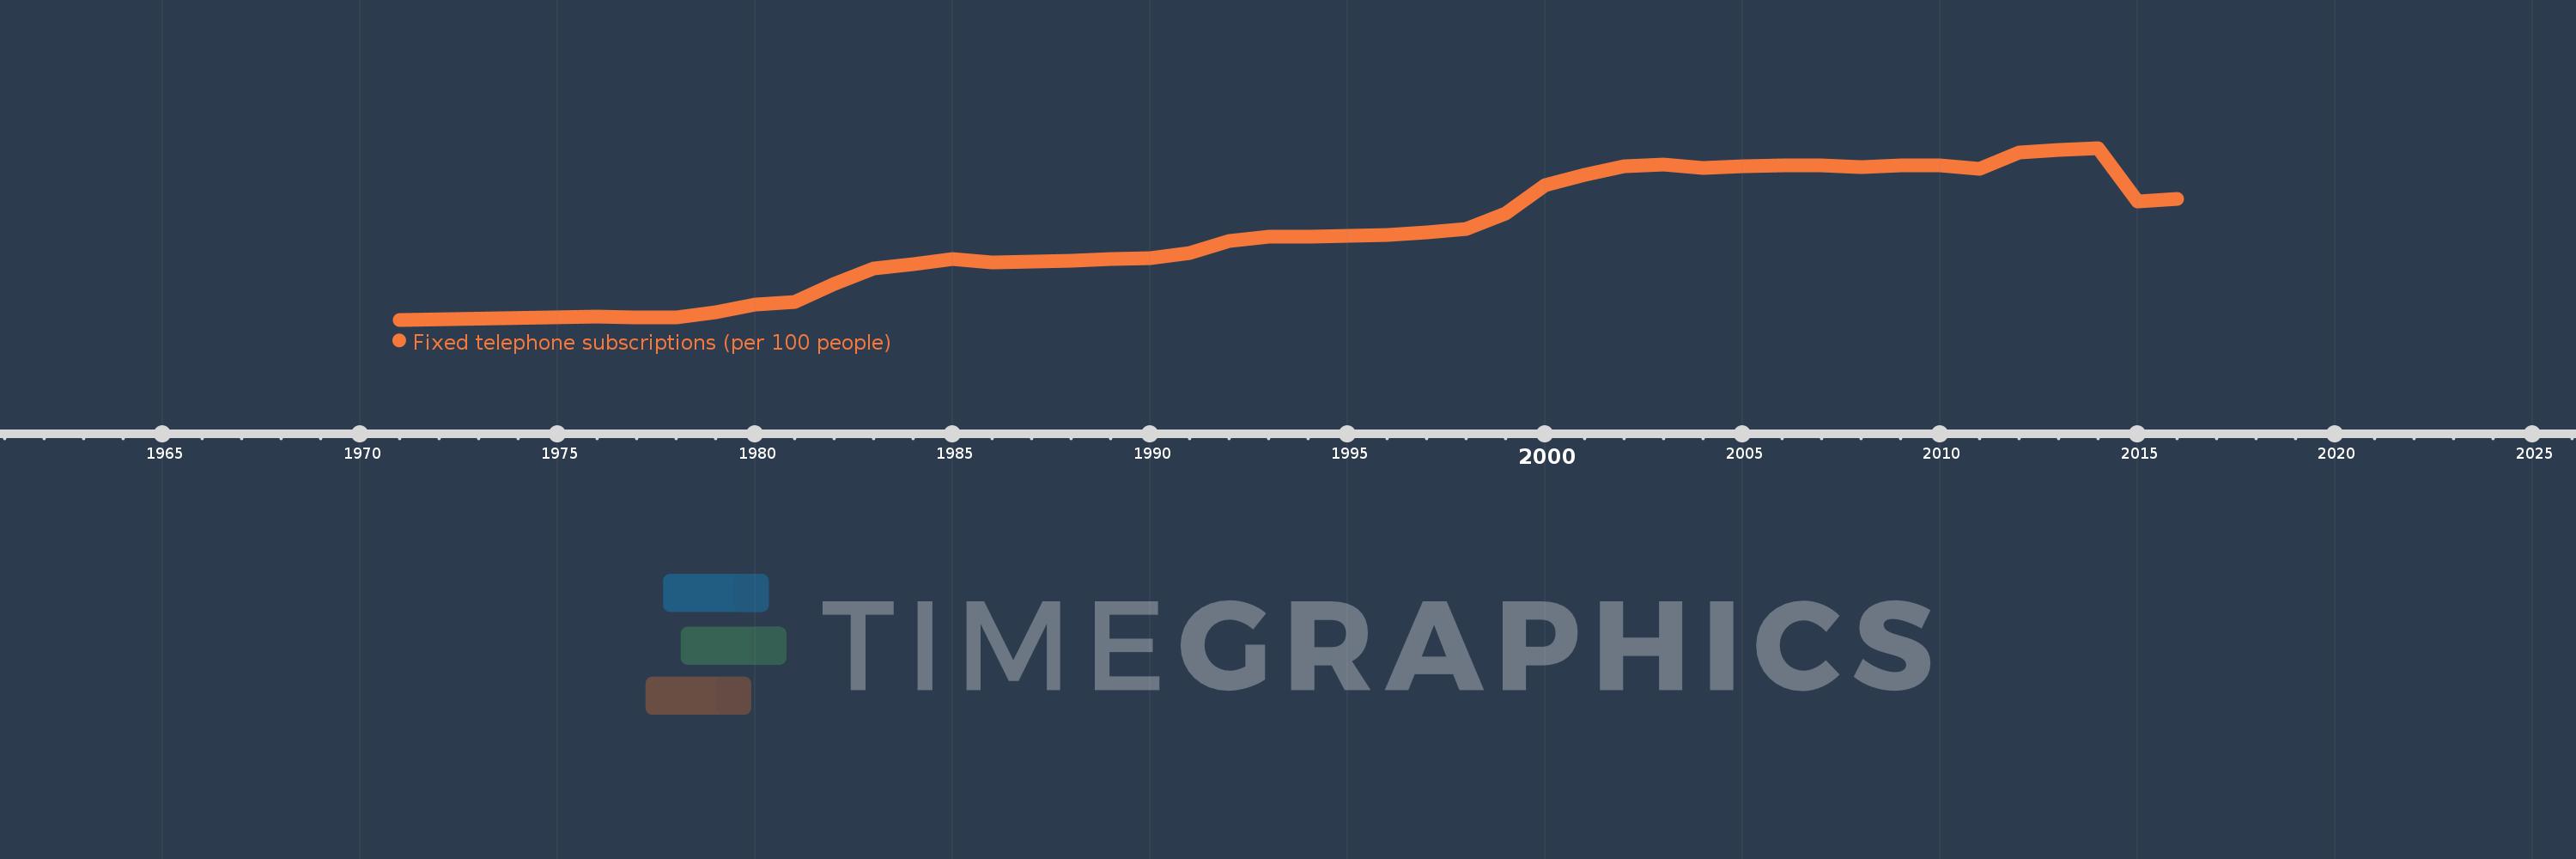
Fixed telephone subscriptions (per 100 people)
2016,2015,2014,2013,2012,2011,2010,2009,2008,2007,2006,2005,2004,2003,2002,2001,2000,1999,1998,1997,1996,1995,1994,1993,1992,1991,1990,1989,1988,1987,1986,1985,1984,1983,1982,1981,1980,1979,1978,1977,1976,1971
This statistics in other country:
AfghanistanAlbaniaAlgeriaAmerican SamoaAndorraAngolaAntigua and BarbudaArab WorldArgentinaArmeniaArubaAustraliaAustriaAzerbaijanBahamas, TheBahrainBangladeshBarbadosBelarusBelgiumBelizeBeninBermudaBhutanBoliviaBosnia and HerzegovinaBotswanaBrazilBritish Virgin IslandsBrunei DarussalamBulgariaBurkina FasoBurundiCabo VerdeCambodiaCameroonCanadaCaribbean small statesCayman IslandsCentral African RepublicCentral Europe and the BalticsChadChileChinaColombiaComorosCongo, Dem. Rep.Congo, Rep.Costa RicaCote d'IvoireCroatiaCubaCuracaoCyprusCzech RepublicDenmarkDjiboutiDominicaDominican RepublicEarly-demographic dividendEast Asia & PacificEast Asia & Pacific (excluding high income)East Asia & Pacific (IDA & IBRD countries)EcuadorEgypt, Arab Rep.El SalvadorEquatorial GuineaEritreaEstoniaEthiopiaEuro areaEurope & Central AsiaEurope & Central Asia (excluding high income)Europe & Central Asia (IDA & IBRD countries)European UnionFaroe IslandsFijiFinlandFragile and conflict affected situationsFranceFrench PolynesiaGabonGambia, TheGeorgiaGermanyGhanaGibraltarGreeceGreenlandGrenadaGuamGuatemalaGuineaGuinea-BissauGuyanaHaitiHeavily indebted poor countries (HIPC)High incomeHondurasHong Kong SAR, ChinaHungaryIBRD onlyIcelandIDA & IBRD totalIDA blendIDA onlyIDA totalIndiaIndonesiaIran, Islamic Rep.IraqIrelandIsraelItalyJamaicaJapanJordanKazakhstanKenyaKiribatiKorea, Dem. People’s Rep.Korea, Rep.KosovoKuwaitKyrgyz RepublicLao PDRLate-demographic dividendLatin America & Caribbean Latin America & Caribbean (excluding high income)Latin America & the Caribbean (IDA & IBRD countries)LatviaLeast developed countries: UN classificationLebanonLesothoLiberiaLibyaLiechtensteinLithuaniaLow & middle incomeLow incomeLower middle incomeLuxembourgMacao SAR, ChinaMacedonia, FYRMadagascarMalawiMalaysiaMaldivesMaliMaltaMarshall IslandsMauritaniaMauritiusMexicoMicronesia, Fed. Sts.Middle East & North AfricaMiddle East & North Africa (excluding high income)Middle East & North Africa (IDA & IBRD countries)Middle incomeMoldovaMonacoMongoliaMontenegroMoroccoMozambiqueMyanmarNamibiaNauruNepalNetherlandsNew CaledoniaNew ZealandNicaraguaNigerNigeriaNorth AmericaNorthern Mariana IslandsNorwayOECD membersOmanOther small statesPacific island small statesPakistanPalauPanamaPapua New GuineaParaguayPeruPhilippinesPolandPortugalPost-demographic dividendPre-demographic dividendPuerto RicoQatarRomaniaRussian FederationRwandaSamoaSan MarinoSao Tome and PrincipeSaudi ArabiaSenegalSerbiaSeychellesSierra LeoneSingaporeSlovak RepublicSloveniaSmall statesSolomon IslandsSomaliaSouth AfricaSouth AsiaSouth Asia (IDA & IBRD)South SudanSpainSri LankaSt. Kitts and NevisSt. LuciaSt. Vincent and the GrenadinesSub-Saharan Africa Sub-Saharan Africa (excluding high income)Sub-Saharan Africa (IDA & IBRD countries)SudanSurinameSwazilandSwedenSwitzerlandSyrian Arab RepublicTajikistanTanzaniaThailandTimor-LesteTogoTongaTrinidad and TobagoTunisiaTurkeyTurkmenistanTurks and Caicos IslandsTuvaluUgandaUkraineUnited Arab EmiratesUnited KingdomUnited StatesUpper middle incomeUruguayUzbekistanVanuatuVenezuela, RBVietnamVirgin Islands (U.S.)West Bank and GazaWorldYemen, Rep.ZambiaZimbabwe Timeline:
This timeline shows a graph from 1971 to 2016 of Saudi Arabia. No data until 1970. Number of actual observations by date: 42.
Source name:
World Development Indicators
Source organization:
International Telecommunication Union, World Telecommunication/ICT Development Report and database.
Categories, topics:
Infrastructure
Last updated:
apr 23, 2017
Indicators value changes by year
Maximum:
17.135
jan 1, 2014
At the date of observation
Value
Absolute change
Change from previous value
jan 1, 1971
1.613
+1.613
0.0%
jan 1, 1976
1.87
+0.257
15.96%
jan 1, 1977
1.81
-0.061
-3.24%
jan 1, 1978
1.858
+0.048
2.63%
jan 1, 1979
2.258
+0.4
21.55%
jan 1, 1980
2.996
+0.738
32.67%
jan 1, 1981
3.247
+0.251
8.38%
jan 1, 1982
4.885
+1.639
50.47%
jan 1, 1983
6.21
+1.325
27.11%
jan 1, 1984
6.653
+0.443
7.14%
jan 1, 1985
7.067
+0.414
6.23%
jan 1, 1986
6.825
-0.242
-3.43%
jan 1, 1987
6.878
+0.054
0.79%
jan 1, 1988
6.91
+0.032
0.47%
jan 1, 1989
7.079
+0.168
2.43%
jan 1, 1990
7.18
+0.101
1.42%
jan 1, 1991
7.614
+0.435
6.06%
jan 1, 1992
8.759
+1.145
15.04%
jan 1, 1993
9.085
+0.325
3.72%
jan 1, 1994
9.093
+0.008
0.09%
jan 1, 1995
9.208
+0.116
1.27%
jan 1, 1996
9.26
+0.052
0.56%
jan 1, 1997
9.529
+0.268
2.9%
jan 1, 1998
9.848
+0.319
3.35%
jan 1, 1999
11.238
+1.39
14.12%
jan 1, 2000
13.792
+2.554
22.73%
jan 1, 2001
14.717
+0.925
6.7%
jan 1, 2002
15.475
+0.758
5.15%
jan 1, 2003
15.656
+0.181
1.17%
jan 1, 2004
15.327
-0.329
-2.1%
jan 1, 2005
15.5
+0.173
1.13%
jan 1, 2006
15.569
+0.069
0.44%
jan 1, 2007
15.572
+0.003
0.02%
jan 1, 2008
15.419
-0.153
-0.98%
jan 1, 2009
15.55
+0.131
0.85%
jan 1, 2010
15.566
+0.015
0.1%
jan 1, 2011
15.282
-0.283
-1.82%
jan 1, 2012
16.689
+1.407
9.2%
jan 1, 2013
16.975
+0.286
1.71%
jan 1, 2014
17.135
+0.16
0.94%
jan 1, 2015
12.333
-4.801
-28.02%
jan 1, 2016
12.532
+0.199
1.61%
Ranking of countries by current statistics by years


Comments: