29
/
en
AIzaSyAYiBZKx7MnpbEhh9jyipgxe19OcubqV5w
April 1, 2024
238234
Seychelles
SYC
true
2
1
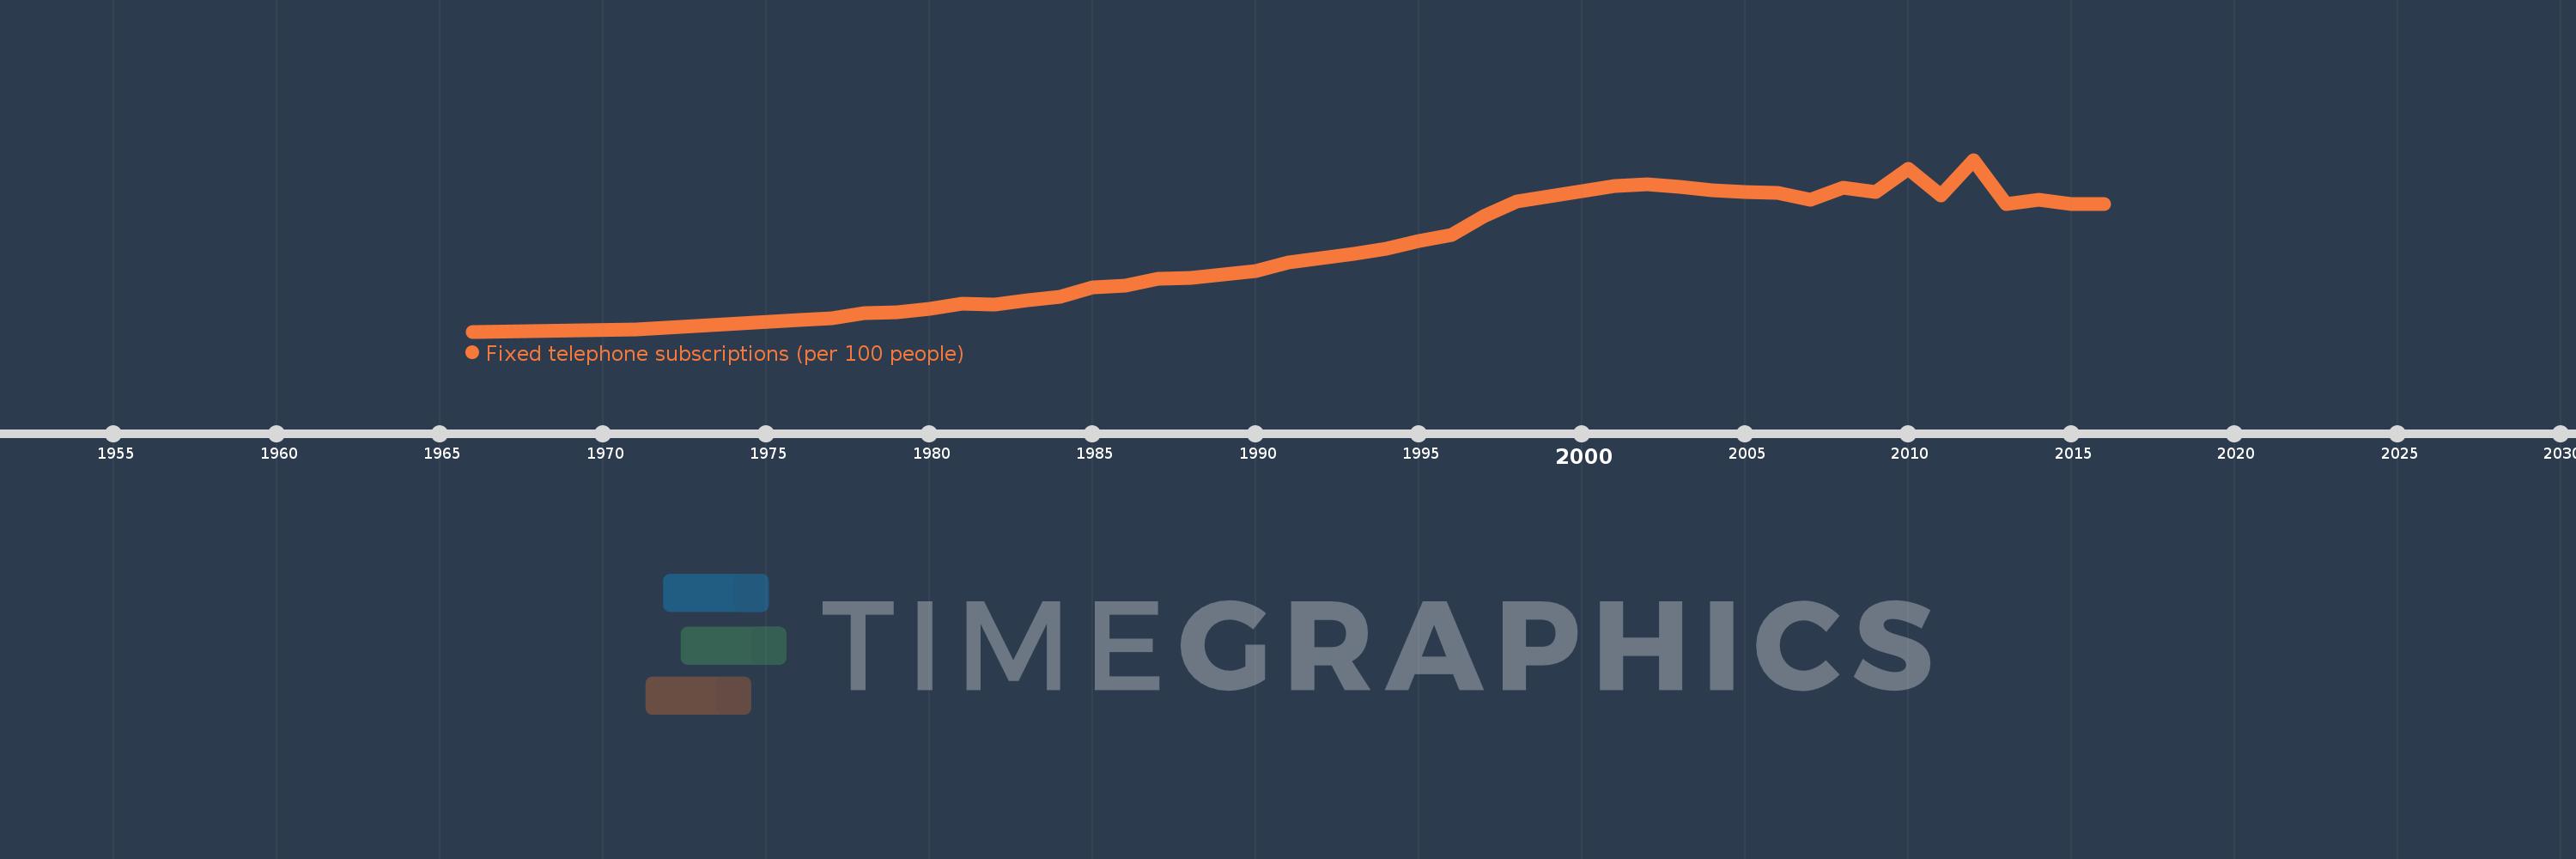
Fixed telephone subscriptions (per 100 people)
2016,2015,2014,2013,2012,2011,2010,2009,2008,2007,2006,2005,2004,2003,2002,2001,2000,1999,1998,1997,1996,1995,1994,1993,1992,1991,1990,1989,1988,1987,1986,1985,1984,1983,1982,1981,1980,1979,1978,1977,1976,1971,1966
This statistics in other country:
AfghanistanAlbaniaAlgeriaAmerican SamoaAndorraAngolaAntigua and BarbudaArab WorldArgentinaArmeniaArubaAustraliaAustriaAzerbaijanBahamas, TheBahrainBangladeshBarbadosBelarusBelgiumBelizeBeninBermudaBhutanBoliviaBosnia and HerzegovinaBotswanaBrazilBritish Virgin IslandsBrunei DarussalamBulgariaBurkina FasoBurundiCabo VerdeCambodiaCameroonCanadaCaribbean small statesCayman IslandsCentral African RepublicCentral Europe and the BalticsChadChileChinaColombiaComorosCongo, Dem. Rep.Congo, Rep.Costa RicaCote d'IvoireCroatiaCubaCuracaoCyprusCzech RepublicDenmarkDjiboutiDominicaDominican RepublicEarly-demographic dividendEast Asia & PacificEast Asia & Pacific (excluding high income)East Asia & Pacific (IDA & IBRD countries)EcuadorEgypt, Arab Rep.El SalvadorEquatorial GuineaEritreaEstoniaEthiopiaEuro areaEurope & Central AsiaEurope & Central Asia (excluding high income)Europe & Central Asia (IDA & IBRD countries)European UnionFaroe IslandsFijiFinlandFragile and conflict affected situationsFranceFrench PolynesiaGabonGambia, TheGeorgiaGermanyGhanaGibraltarGreeceGreenlandGrenadaGuamGuatemalaGuineaGuinea-BissauGuyanaHaitiHeavily indebted poor countries (HIPC)High incomeHondurasHong Kong SAR, ChinaHungaryIBRD onlyIcelandIDA & IBRD totalIDA blendIDA onlyIDA totalIndiaIndonesiaIran, Islamic Rep.IraqIrelandIsraelItalyJamaicaJapanJordanKazakhstanKenyaKiribatiKorea, Dem. People’s Rep.Korea, Rep.KosovoKuwaitKyrgyz RepublicLao PDRLate-demographic dividendLatin America & Caribbean Latin America & Caribbean (excluding high income)Latin America & the Caribbean (IDA & IBRD countries)LatviaLeast developed countries: UN classificationLebanonLesothoLiberiaLibyaLiechtensteinLithuaniaLow & middle incomeLow incomeLower middle incomeLuxembourgMacao SAR, ChinaMacedonia, FYRMadagascarMalawiMalaysiaMaldivesMaliMaltaMarshall IslandsMauritaniaMauritiusMexicoMicronesia, Fed. Sts.Middle East & North AfricaMiddle East & North Africa (excluding high income)Middle East & North Africa (IDA & IBRD countries)Middle incomeMoldovaMonacoMongoliaMontenegroMoroccoMozambiqueMyanmarNamibiaNauruNepalNetherlandsNew CaledoniaNew ZealandNicaraguaNigerNigeriaNorth AmericaNorthern Mariana IslandsNorwayOECD membersOmanOther small statesPacific island small statesPakistanPalauPanamaPapua New GuineaParaguayPeruPhilippinesPolandPortugalPost-demographic dividendPre-demographic dividendPuerto RicoQatarRomaniaRussian FederationRwandaSamoaSan MarinoSao Tome and PrincipeSaudi ArabiaSenegalSerbiaSeychellesSierra LeoneSingaporeSlovak RepublicSloveniaSmall statesSolomon IslandsSomaliaSouth AfricaSouth AsiaSouth Asia (IDA & IBRD)South SudanSpainSri LankaSt. Kitts and NevisSt. LuciaSt. Vincent and the GrenadinesSub-Saharan Africa Sub-Saharan Africa (excluding high income)Sub-Saharan Africa (IDA & IBRD countries)SudanSurinameSwazilandSwedenSwitzerlandSyrian Arab RepublicTajikistanTanzaniaThailandTimor-LesteTogoTongaTrinidad and TobagoTunisiaTurkeyTurkmenistanTurks and Caicos IslandsTuvaluUgandaUkraineUnited Arab EmiratesUnited KingdomUnited StatesUpper middle incomeUruguayUzbekistanVanuatuVenezuela, RBVietnamVirgin Islands (U.S.)West Bank and GazaWorldYemen, Rep.ZambiaZimbabwe Timeline:
This timeline shows a graph from 1966 to 2016 of Seychelles. No data until 1965. Number of actual observations by date: 43.
Source name:
World Development Indicators
Source organization:
International Telecommunication Union, World Telecommunication/ICT Development Report and database.
Categories, topics:
Infrastructure
Last updated:
apr 23, 2017
Indicators value changes by year
Maximum:
30.406
jan 1, 2012
At the date of observation
Value
Absolute change
Change from previous value
jan 1, 1966
0.498
+0.498
0.0%
jan 1, 1971
0.843
+0.345
69.26%
jan 1, 1976
2.498
+1.654
196.11%
jan 1, 1977
2.818
+0.321
12.84%
jan 1, 1978
3.641
+0.823
29.21%
jan 1, 1979
3.897
+0.256
7.02%
jan 1, 1980
4.412
+0.515
13.21%
jan 1, 1981
5.329
+0.917
20.79%
jan 1, 1982
5.253
-0.076
-1.43%
jan 1, 1983
5.982
+0.73
13.89%
jan 1, 1984
6.621
+0.639
10.67%
jan 1, 1985
8.145
+1.524
23.02%
jan 1, 1986
8.543
+0.398
4.89%
jan 1, 1987
9.726
+1.183
13.85%
jan 1, 1988
9.851
+0.125
1.28%
jan 1, 1989
10.474
+0.623
6.32%
jan 1, 1990
11.023
+0.549
5.24%
jan 1, 1991
12.492
+1.47
13.34%
jan 1, 1992
13.297
+0.805
6.44%
jan 1, 1993
14.083
+0.786
5.91%
jan 1, 1994
14.97
+0.887
6.3%
jan 1, 1995
16.312
+1.342
8.97%
jan 1, 1996
17.381
+1.069
6.55%
jan 1, 1997
20.568
+3.187
18.34%
jan 1, 1998
23.122
+2.554
12.42%
jan 1, 1999
24.072
+0.95
4.11%
jan 1, 2000
24.943
+0.871
3.62%
jan 1, 2001
25.849
+0.906
3.63%
jan 1, 2002
26.201
+0.352
1.36%
jan 1, 2003
25.722
-0.479
-1.83%
jan 1, 2004
25.162
-0.56
-2.18%
jan 1, 2005
24.802
-0.36
-1.43%
jan 1, 2006
24.576
-0.226
-0.91%
jan 1, 2007
23.443
-1.133
-4.61%
jan 1, 2008
25.492
+2.049
8.74%
jan 1, 2009
24.829
-0.663
-2.6%
jan 1, 2010
28.791
+3.962
15.96%
jan 1, 2011
24.17
-4.621
-16.05%
jan 1, 2012
30.406
+6.236
25.8%
jan 1, 2013
22.686
-7.72
-25.39%
jan 1, 2014
23.43
+0.744
3.28%
jan 1, 2015
22.73
-0.701
-2.99%
jan 1, 2016
22.763
+0.033
0.15%
Ranking of countries by current statistics by years


Comments: