29
/
en
AIzaSyAYiBZKx7MnpbEhh9jyipgxe19OcubqV5w
April 1, 2024
118885
Denmark
DNK
true
2
1
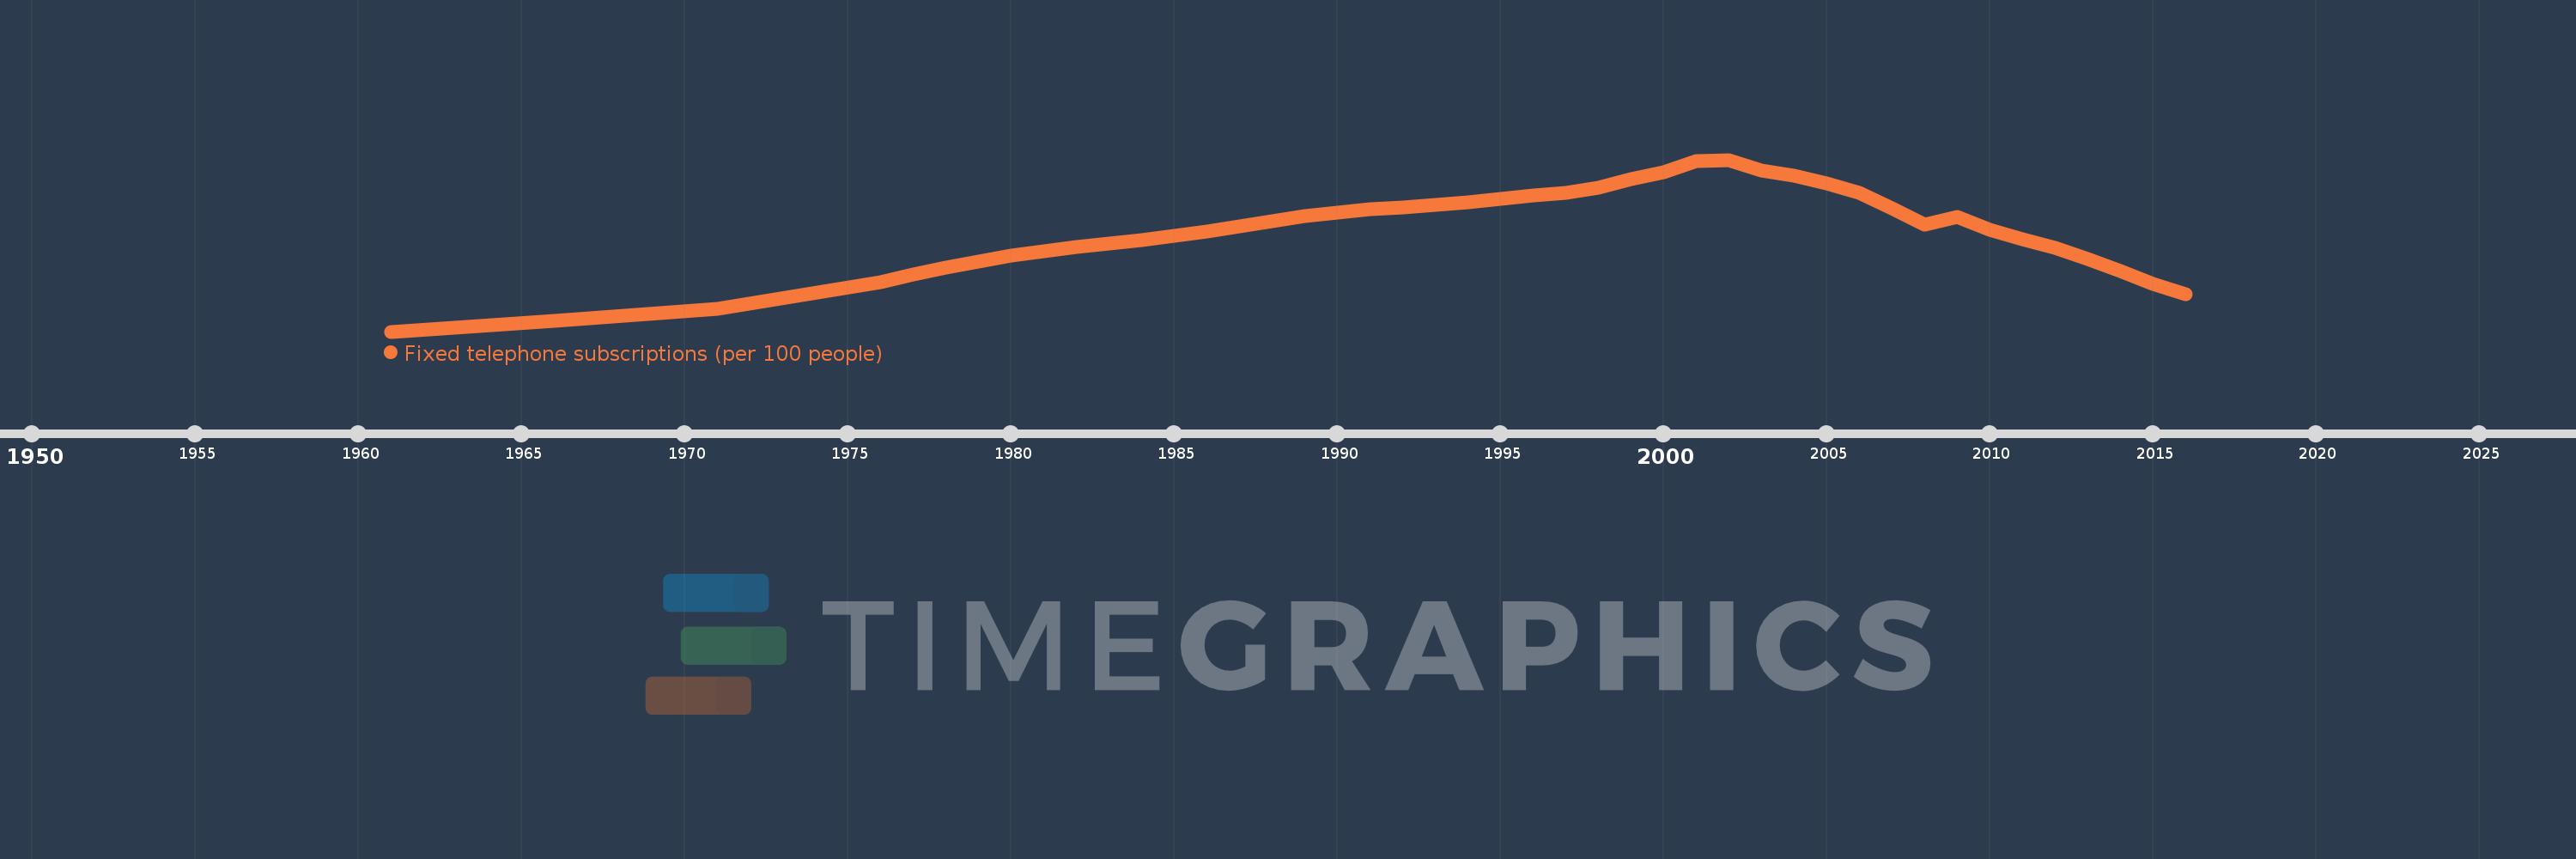
Fixed telephone subscriptions (per 100 people)
2016,2015,2014,2013,2012,2011,2010,2009,2008,2007,2006,2005,2004,2003,2002,2001,2000,1999,1998,1997,1996,1995,1994,1993,1992,1991,1990,1989,1988,1987,1986,1985,1984,1983,1982,1981,1980,1979,1978,1977,1976,1971,1966,1961
This statistics in other country:
AfghanistanAlbaniaAlgeriaAmerican SamoaAndorraAngolaAntigua and BarbudaArab WorldArgentinaArmeniaArubaAustraliaAustriaAzerbaijanBahamas, TheBahrainBangladeshBarbadosBelarusBelgiumBelizeBeninBermudaBhutanBoliviaBosnia and HerzegovinaBotswanaBrazilBritish Virgin IslandsBrunei DarussalamBulgariaBurkina FasoBurundiCabo VerdeCambodiaCameroonCanadaCaribbean small statesCayman IslandsCentral African RepublicCentral Europe and the BalticsChadChileChinaColombiaComorosCongo, Dem. Rep.Congo, Rep.Costa RicaCote d'IvoireCroatiaCubaCuracaoCyprusCzech RepublicDenmarkDjiboutiDominicaDominican RepublicEarly-demographic dividendEast Asia & PacificEast Asia & Pacific (excluding high income)East Asia & Pacific (IDA & IBRD countries)EcuadorEgypt, Arab Rep.El SalvadorEquatorial GuineaEritreaEstoniaEthiopiaEuro areaEurope & Central AsiaEurope & Central Asia (excluding high income)Europe & Central Asia (IDA & IBRD countries)European UnionFaroe IslandsFijiFinlandFragile and conflict affected situationsFranceFrench PolynesiaGabonGambia, TheGeorgiaGermanyGhanaGibraltarGreeceGreenlandGrenadaGuamGuatemalaGuineaGuinea-BissauGuyanaHaitiHeavily indebted poor countries (HIPC)High incomeHondurasHong Kong SAR, ChinaHungaryIBRD onlyIcelandIDA & IBRD totalIDA blendIDA onlyIDA totalIndiaIndonesiaIran, Islamic Rep.IraqIrelandIsraelItalyJamaicaJapanJordanKazakhstanKenyaKiribatiKorea, Dem. People’s Rep.Korea, Rep.KosovoKuwaitKyrgyz RepublicLao PDRLate-demographic dividendLatin America & Caribbean Latin America & Caribbean (excluding high income)Latin America & the Caribbean (IDA & IBRD countries)LatviaLeast developed countries: UN classificationLebanonLesothoLiberiaLibyaLiechtensteinLithuaniaLow & middle incomeLow incomeLower middle incomeLuxembourgMacao SAR, ChinaMacedonia, FYRMadagascarMalawiMalaysiaMaldivesMaliMaltaMarshall IslandsMauritaniaMauritiusMexicoMicronesia, Fed. Sts.Middle East & North AfricaMiddle East & North Africa (excluding high income)Middle East & North Africa (IDA & IBRD countries)Middle incomeMoldovaMonacoMongoliaMontenegroMoroccoMozambiqueMyanmarNamibiaNauruNepalNetherlandsNew CaledoniaNew ZealandNicaraguaNigerNigeriaNorth AmericaNorthern Mariana IslandsNorwayOECD membersOmanOther small statesPacific island small statesPakistanPalauPanamaPapua New GuineaParaguayPeruPhilippinesPolandPortugalPost-demographic dividendPre-demographic dividendPuerto RicoQatarRomaniaRussian FederationRwandaSamoaSan MarinoSao Tome and PrincipeSaudi ArabiaSenegalSerbiaSeychellesSierra LeoneSingaporeSlovak RepublicSloveniaSmall statesSolomon IslandsSomaliaSouth AfricaSouth AsiaSouth Asia (IDA & IBRD)South SudanSpainSri LankaSt. Kitts and NevisSt. LuciaSt. Vincent and the GrenadinesSub-Saharan Africa Sub-Saharan Africa (excluding high income)Sub-Saharan Africa (IDA & IBRD countries)SudanSurinameSwazilandSwedenSwitzerlandSyrian Arab RepublicTajikistanTanzaniaThailandTimor-LesteTogoTongaTrinidad and TobagoTunisiaTurkeyTurkmenistanTurks and Caicos IslandsTuvaluUgandaUkraineUnited Arab EmiratesUnited KingdomUnited StatesUpper middle incomeUruguayUzbekistanVanuatuVenezuela, RBVietnamVirgin Islands (U.S.)West Bank and GazaWorldYemen, Rep.ZambiaZimbabwe Timeline:
This timeline shows a graph from 1961 to 2016 of Denmark. No data until 1960. Number of actual observations by date: 44.
Source name:
World Development Indicators
Source organization:
International Telecommunication Union, World Telecommunication/ICT Development Report and database.
Categories, topics:
Infrastructure
Last updated:
apr 23, 2017
Indicators value changes by year
Minimum:
18.207
jan 1, 1961
Maximum:
72.177
jan 1, 2002
At the date of observation
Value
Absolute change
Change from previous value
jan 1, 1961
18.207
+18.207
0.0%
jan 1, 1966
21.656
+3.449
18.94%
jan 1, 1971
25.334
+3.679
16.99%
jan 1, 1976
33.72
+8.386
33.1%
jan 1, 1977
36.127
+2.407
7.14%
jan 1, 1978
38.35
+2.223
6.15%
jan 1, 1979
40.227
+1.877
4.89%
jan 1, 1980
42.111
+1.883
4.68%
jan 1, 1981
43.443
+1.332
3.16%
jan 1, 1982
44.658
+1.215
2.8%
jan 1, 1983
45.902
+1.244
2.78%
jan 1, 1984
46.948
+1.046
2.28%
jan 1, 1985
48.208
+1.26
2.68%
jan 1, 1986
49.738
+1.53
3.17%
jan 1, 1987
51.398
+1.66
3.34%
jan 1, 1988
53.0
+1.603
3.12%
jan 1, 1989
54.51
+1.51
2.85%
jan 1, 1990
55.52
+1.01
1.85%
jan 1, 1991
56.634
+1.115
2.01%
jan 1, 1992
57.248
+0.614
1.08%
jan 1, 1993
58.108
+0.86
1.5%
jan 1, 1994
58.949
+0.841
1.45%
jan 1, 1995
59.928
+0.979
1.66%
jan 1, 1996
61.029
+1.102
1.84%
jan 1, 1997
61.875
+0.845
1.38%
jan 1, 1998
63.307
+1.432
2.31%
jan 1, 1999
65.976
+2.669
4.22%
jan 1, 2000
68.393
+2.417
3.66%
jan 1, 2001
71.84
+3.446
5.04%
jan 1, 2002
72.177
+0.337
0.47%
jan 1, 2003
68.93
-3.246
-4.5%
jan 1, 2004
67.144
-1.787
-2.59%
jan 1, 2005
64.671
-2.473
-3.68%
jan 1, 2006
61.801
-2.87
-4.44%
jan 1, 2007
56.95
-4.851
-7.85%
jan 1, 2008
51.67
-5.279
-9.27%
jan 1, 2009
54.13
+2.46
4.76%
jan 1, 2010
50.219
-3.911
-7.23%
jan 1, 2011
47.087
-3.132
-6.24%
jan 1, 2012
44.509
-2.578
-5.47%
jan 1, 2013
41.076
-3.433
-7.71%
jan 1, 2014
37.276
-3.8
-9.25%
jan 1, 2015
33.215
-4.06
-10.89%
jan 1, 2016
29.921
-3.294
-9.92%
Ranking of countries by current statistics by years


Comments: