29
/
en
AIzaSyAYiBZKx7MnpbEhh9jyipgxe19OcubqV5w
April 1, 2024
48107
Middle East & North Africa
MEA
false
2
1
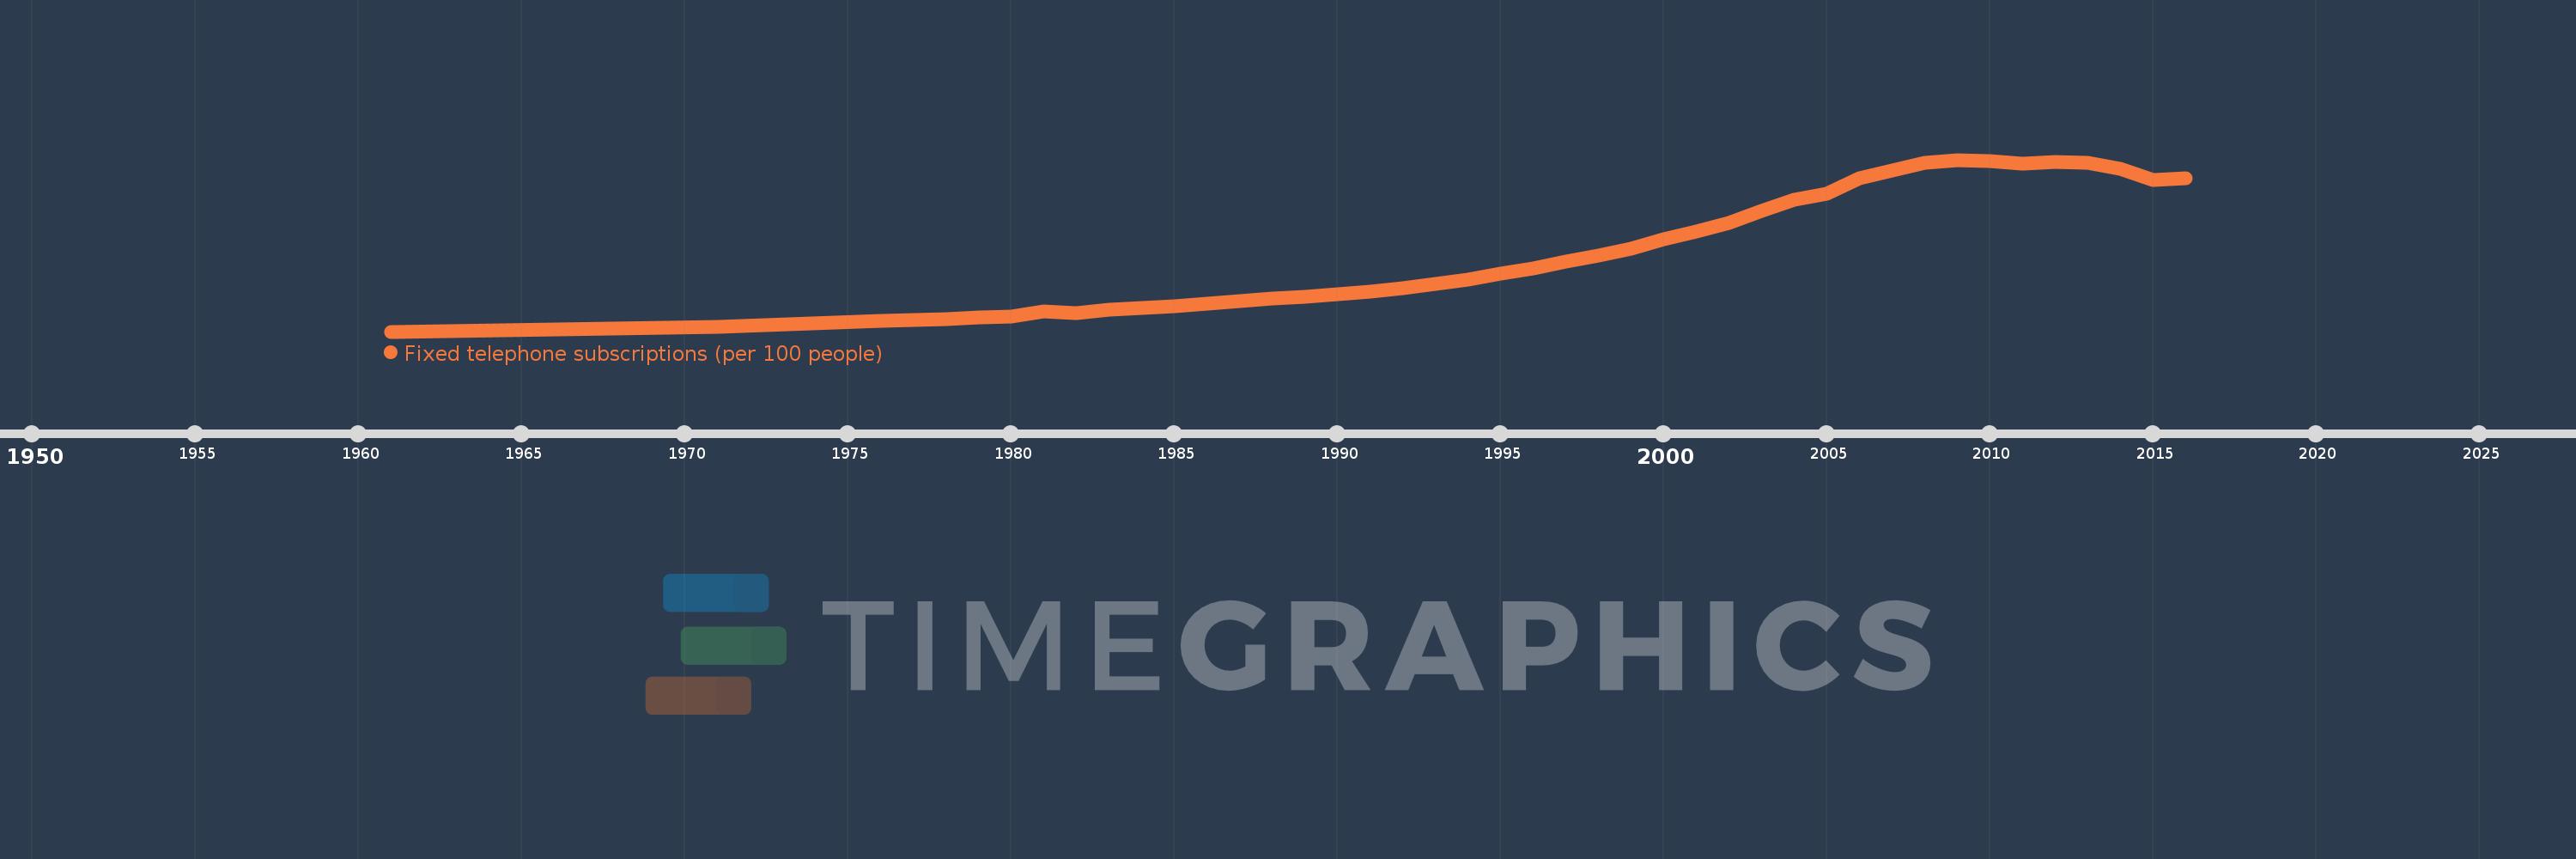
Fixed telephone subscriptions (per 100 people)
2016,2015,2014,2013,2012,2011,2010,2009,2008,2007,2006,2005,2004,2003,2002,2001,2000,1999,1998,1997,1996,1995,1994,1993,1992,1991,1990,1989,1988,1987,1986,1985,1984,1983,1982,1981,1980,1979,1978,1977,1976,1971,1961
This statistics in other country:
AfghanistanAlbaniaAlgeriaAmerican SamoaAndorraAngolaAntigua and BarbudaArab WorldArgentinaArmeniaArubaAustraliaAustriaAzerbaijanBahamas, TheBahrainBangladeshBarbadosBelarusBelgiumBelizeBeninBermudaBhutanBoliviaBosnia and HerzegovinaBotswanaBrazilBritish Virgin IslandsBrunei DarussalamBulgariaBurkina FasoBurundiCabo VerdeCambodiaCameroonCanadaCaribbean small statesCayman IslandsCentral African RepublicCentral Europe and the BalticsChadChileChinaColombiaComorosCongo, Dem. Rep.Congo, Rep.Costa RicaCote d'IvoireCroatiaCubaCuracaoCyprusCzech RepublicDenmarkDjiboutiDominicaDominican RepublicEarly-demographic dividendEast Asia & PacificEast Asia & Pacific (excluding high income)East Asia & Pacific (IDA & IBRD countries)EcuadorEgypt, Arab Rep.El SalvadorEquatorial GuineaEritreaEstoniaEthiopiaEuro areaEurope & Central AsiaEurope & Central Asia (excluding high income)Europe & Central Asia (IDA & IBRD countries)European UnionFaroe IslandsFijiFinlandFragile and conflict affected situationsFranceFrench PolynesiaGabonGambia, TheGeorgiaGermanyGhanaGibraltarGreeceGreenlandGrenadaGuamGuatemalaGuineaGuinea-BissauGuyanaHaitiHeavily indebted poor countries (HIPC)High incomeHondurasHong Kong SAR, ChinaHungaryIBRD onlyIcelandIDA & IBRD totalIDA blendIDA onlyIDA totalIndiaIndonesiaIran, Islamic Rep.IraqIrelandIsraelItalyJamaicaJapanJordanKazakhstanKenyaKiribatiKorea, Dem. People’s Rep.Korea, Rep.KosovoKuwaitKyrgyz RepublicLao PDRLate-demographic dividendLatin America & Caribbean Latin America & Caribbean (excluding high income)Latin America & the Caribbean (IDA & IBRD countries)LatviaLeast developed countries: UN classificationLebanonLesothoLiberiaLibyaLiechtensteinLithuaniaLow & middle incomeLow incomeLower middle incomeLuxembourgMacao SAR, ChinaMacedonia, FYRMadagascarMalawiMalaysiaMaldivesMaliMaltaMarshall IslandsMauritaniaMauritiusMexicoMicronesia, Fed. Sts.Middle East & North AfricaMiddle East & North Africa (excluding high income)Middle East & North Africa (IDA & IBRD countries)Middle incomeMoldovaMonacoMongoliaMontenegroMoroccoMozambiqueMyanmarNamibiaNauruNepalNetherlandsNew CaledoniaNew ZealandNicaraguaNigerNigeriaNorth AmericaNorthern Mariana IslandsNorwayOECD membersOmanOther small statesPacific island small statesPakistanPalauPanamaPapua New GuineaParaguayPeruPhilippinesPolandPortugalPost-demographic dividendPre-demographic dividendPuerto RicoQatarRomaniaRussian FederationRwandaSamoaSan MarinoSao Tome and PrincipeSaudi ArabiaSenegalSerbiaSeychellesSierra LeoneSingaporeSlovak RepublicSloveniaSmall statesSolomon IslandsSomaliaSouth AfricaSouth AsiaSouth Asia (IDA & IBRD)South SudanSpainSri LankaSt. Kitts and NevisSt. LuciaSt. Vincent and the GrenadinesSub-Saharan Africa Sub-Saharan Africa (excluding high income)Sub-Saharan Africa (IDA & IBRD countries)SudanSurinameSwazilandSwedenSwitzerlandSyrian Arab RepublicTajikistanTanzaniaThailandTimor-LesteTogoTongaTrinidad and TobagoTunisiaTurkeyTurkmenistanTurks and Caicos IslandsTuvaluUgandaUkraineUnited Arab EmiratesUnited KingdomUnited StatesUpper middle incomeUruguayUzbekistanVanuatuVenezuela, RBVietnamVirgin Islands (U.S.)West Bank and GazaWorldYemen, Rep.ZambiaZimbabwe Timeline:
This timeline shows a graph from 1961 to 2016 of Middle East & North Africa. No data until 1960. Number of actual observations by date: 43.
Source name:
World Development Indicators
Source organization:
International Telecommunication Union, World Telecommunication/ICT Development Report and database.
Categories, topics:
Infrastructure
Last updated:
apr 23, 2017
Indicators value changes by year
At the date of observation
Value
Absolute change
Change from previous value
jan 1, 1961
0.763
+0.763
0.0%
jan 1, 1971
1.188
+0.425
55.63%
jan 1, 1976
1.757
+0.569
47.88%
jan 1, 1977
1.895
+0.139
7.9%
jan 1, 1978
1.971
+0.076
4.01%
jan 1, 1979
2.076
+0.105
5.32%
jan 1, 1980
2.217
+0.141
6.79%
jan 1, 1981
2.707
+0.49
22.08%
jan 1, 1982
2.527
-0.18
-6.66%
jan 1, 1983
2.852
+0.326
12.89%
jan 1, 1984
3.028
+0.176
6.16%
jan 1, 1985
3.18
+0.152
5.02%
jan 1, 1986
3.461
+0.281
8.82%
jan 1, 1987
3.703
+0.242
7.0%
jan 1, 1988
3.912
+0.209
5.65%
jan 1, 1989
4.114
+0.202
5.15%
jan 1, 1990
4.311
+0.197
4.8%
jan 1, 1991
4.571
+0.259
6.02%
jan 1, 1992
4.871
+0.301
6.57%
jan 1, 1993
5.296
+0.425
8.73%
jan 1, 1994
5.742
+0.445
8.41%
jan 1, 1995
6.254
+0.512
8.92%
jan 1, 1996
6.816
+0.562
8.98%
jan 1, 1997
7.394
+0.578
8.48%
jan 1, 1998
7.965
+0.571
7.72%
jan 1, 1999
8.698
+0.733
9.21%
jan 1, 2000
9.547
+0.849
9.76%
jan 1, 2001
10.287
+0.74
7.76%
jan 1, 2002
11.147
+0.86
8.36%
jan 1, 2003
12.289
+1.142
10.25%
jan 1, 2004
13.337
+1.048
8.53%
jan 1, 2005
13.896
+0.559
4.19%
jan 1, 2006
15.345
+1.449
10.43%
jan 1, 2007
16.117
+0.772
5.03%
jan 1, 2008
16.81
+0.693
4.3%
jan 1, 2009
17.13
+0.32
1.9%
jan 1, 2010
16.981
-0.149
-0.87%
jan 1, 2011
16.729
-0.252
-1.48%
jan 1, 2012
16.927
+0.198
1.18%
jan 1, 2013
16.882
-0.045
-0.26%
jan 1, 2014
16.308
-0.574
-3.4%
jan 1, 2015
15.21
-1.098
-6.73%
jan 1, 2016
15.33
+0.12
0.79%
Ranking of countries by current statistics by years


Comments: