29
/
en
AIzaSyAYiBZKx7MnpbEhh9jyipgxe19OcubqV5w
April 1, 2024
270487
Turkmenistan
TKM
true
2
1
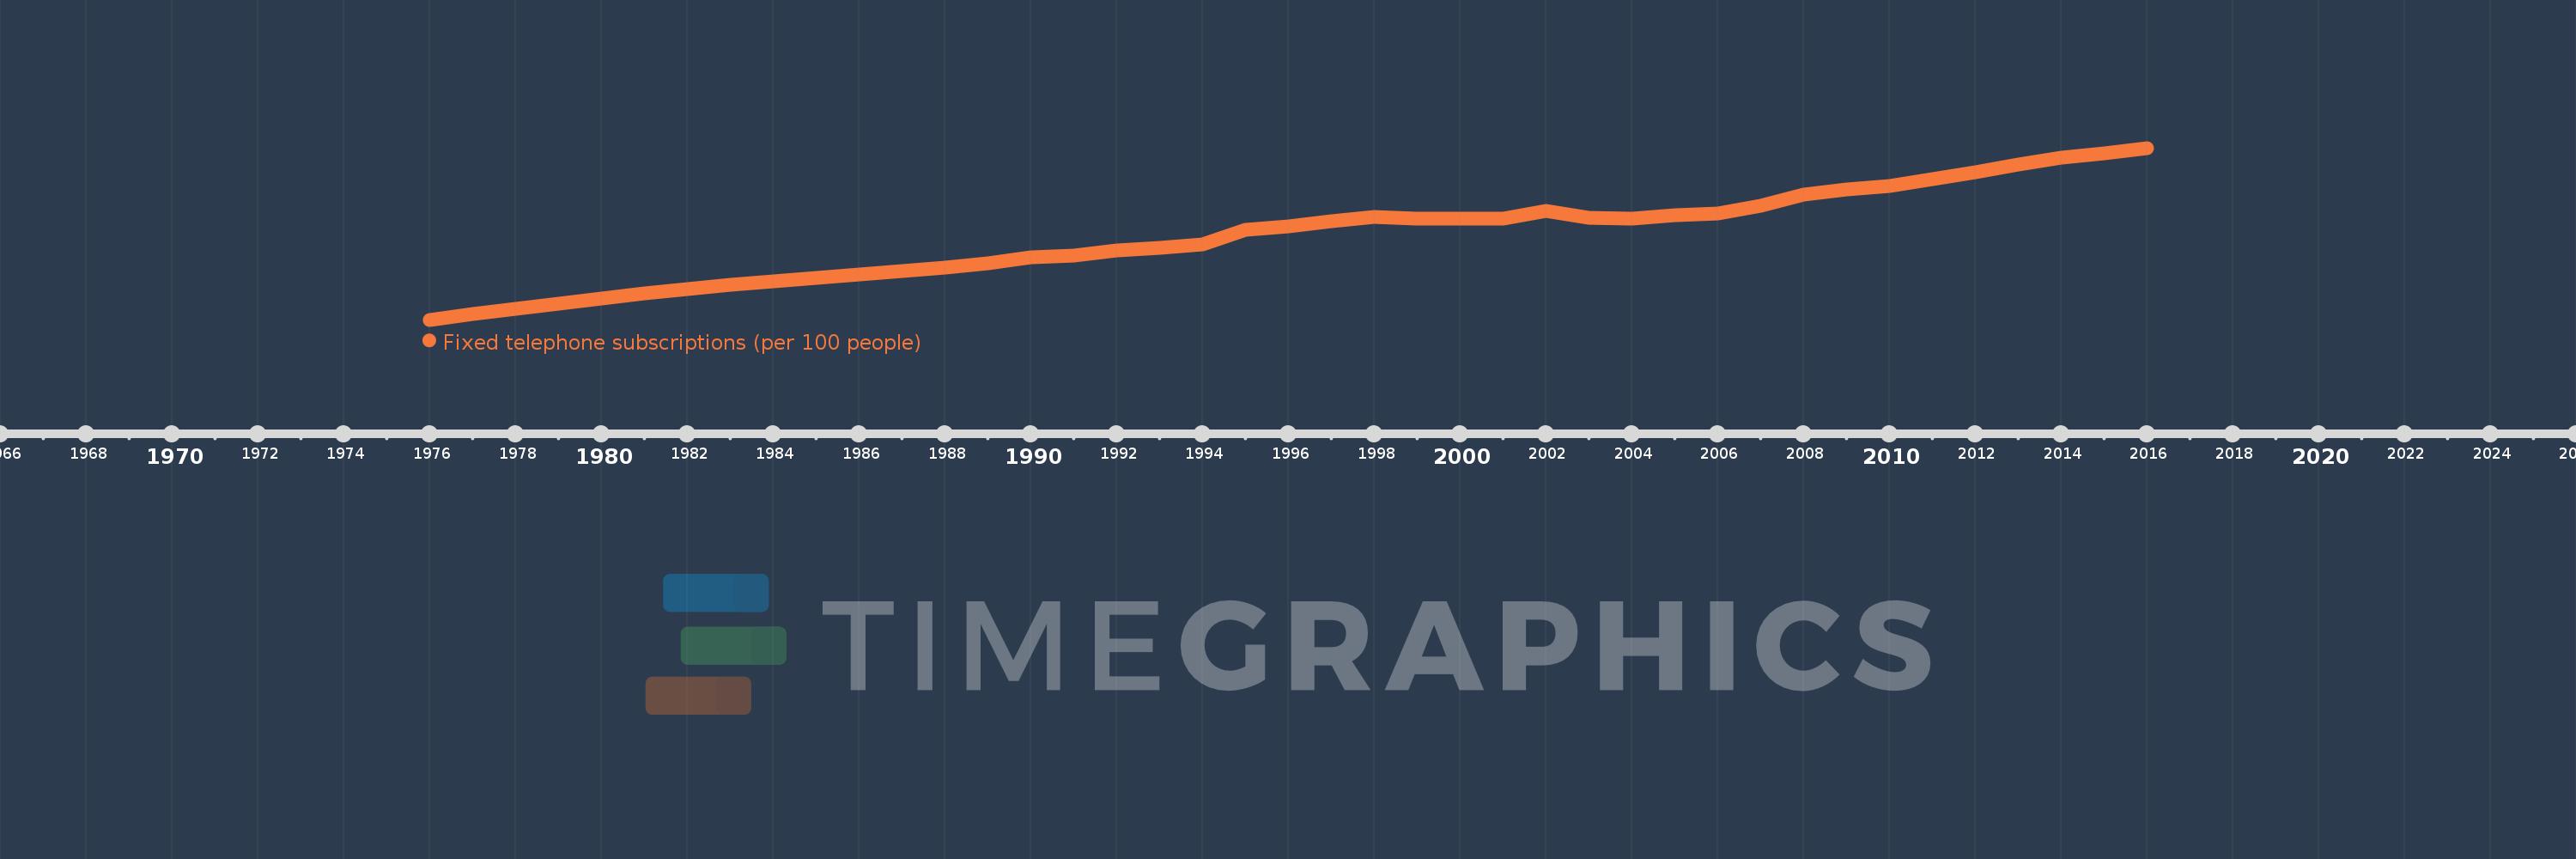
Fixed telephone subscriptions (per 100 people)
2016,2015,2014,2013,2012,2011,2010,2009,2008,2007,2006,2005,2004,2003,2002,2001,2000,1999,1998,1997,1996,1995,1994,1993,1992,1991,1990,1989,1988,1987,1986,1985,1984,1983,1982,1981,1980,1979,1978,1977,1976
This statistics in other country:
AfghanistanAlbaniaAlgeriaAmerican SamoaAndorraAngolaAntigua and BarbudaArab WorldArgentinaArmeniaArubaAustraliaAustriaAzerbaijanBahamas, TheBahrainBangladeshBarbadosBelarusBelgiumBelizeBeninBermudaBhutanBoliviaBosnia and HerzegovinaBotswanaBrazilBritish Virgin IslandsBrunei DarussalamBulgariaBurkina FasoBurundiCabo VerdeCambodiaCameroonCanadaCaribbean small statesCayman IslandsCentral African RepublicCentral Europe and the BalticsChadChileChinaColombiaComorosCongo, Dem. Rep.Congo, Rep.Costa RicaCote d'IvoireCroatiaCubaCuracaoCyprusCzech RepublicDenmarkDjiboutiDominicaDominican RepublicEarly-demographic dividendEast Asia & PacificEast Asia & Pacific (excluding high income)East Asia & Pacific (IDA & IBRD countries)EcuadorEgypt, Arab Rep.El SalvadorEquatorial GuineaEritreaEstoniaEthiopiaEuro areaEurope & Central AsiaEurope & Central Asia (excluding high income)Europe & Central Asia (IDA & IBRD countries)European UnionFaroe IslandsFijiFinlandFragile and conflict affected situationsFranceFrench PolynesiaGabonGambia, TheGeorgiaGermanyGhanaGibraltarGreeceGreenlandGrenadaGuamGuatemalaGuineaGuinea-BissauGuyanaHaitiHeavily indebted poor countries (HIPC)High incomeHondurasHong Kong SAR, ChinaHungaryIBRD onlyIcelandIDA & IBRD totalIDA blendIDA onlyIDA totalIndiaIndonesiaIran, Islamic Rep.IraqIrelandIsraelItalyJamaicaJapanJordanKazakhstanKenyaKiribatiKorea, Dem. People’s Rep.Korea, Rep.KosovoKuwaitKyrgyz RepublicLao PDRLate-demographic dividendLatin America & Caribbean Latin America & Caribbean (excluding high income)Latin America & the Caribbean (IDA & IBRD countries)LatviaLeast developed countries: UN classificationLebanonLesothoLiberiaLibyaLiechtensteinLithuaniaLow & middle incomeLow incomeLower middle incomeLuxembourgMacao SAR, ChinaMacedonia, FYRMadagascarMalawiMalaysiaMaldivesMaliMaltaMarshall IslandsMauritaniaMauritiusMexicoMicronesia, Fed. Sts.Middle East & North AfricaMiddle East & North Africa (excluding high income)Middle East & North Africa (IDA & IBRD countries)Middle incomeMoldovaMonacoMongoliaMontenegroMoroccoMozambiqueMyanmarNamibiaNauruNepalNetherlandsNew CaledoniaNew ZealandNicaraguaNigerNigeriaNorth AmericaNorthern Mariana IslandsNorwayOECD membersOmanOther small statesPacific island small statesPakistanPalauPanamaPapua New GuineaParaguayPeruPhilippinesPolandPortugalPost-demographic dividendPre-demographic dividendPuerto RicoQatarRomaniaRussian FederationRwandaSamoaSan MarinoSao Tome and PrincipeSaudi ArabiaSenegalSerbiaSeychellesSierra LeoneSingaporeSlovak RepublicSloveniaSmall statesSolomon IslandsSomaliaSouth AfricaSouth AsiaSouth Asia (IDA & IBRD)South SudanSpainSri LankaSt. Kitts and NevisSt. LuciaSt. Vincent and the GrenadinesSub-Saharan Africa Sub-Saharan Africa (excluding high income)Sub-Saharan Africa (IDA & IBRD countries)SudanSurinameSwazilandSwedenSwitzerlandSyrian Arab RepublicTajikistanTanzaniaThailandTimor-LesteTogoTongaTrinidad and TobagoTunisiaTurkeyTurkmenistanTurks and Caicos IslandsTuvaluUgandaUkraineUnited Arab EmiratesUnited KingdomUnited StatesUpper middle incomeUruguayUzbekistanVanuatuVenezuela, RBVietnamVirgin Islands (U.S.)West Bank and GazaWorldYemen, Rep.ZambiaZimbabwe Timeline:
This timeline shows a graph from 1976 to 2016 of Turkmenistan. No data until 1975. Number of actual observations by date: 41.
Source name:
World Development Indicators
Source organization:
International Telecommunication Union, World Telecommunication/ICT Development Report and database.
Categories, topics:
Infrastructure
Last updated:
apr 23, 2017
Indicators value changes by year
Maximum:
12.059
jan 1, 2016
At the date of observation
Value
Absolute change
Change from previous value
jan 1, 1976
2.381
+2.381
0.0%
jan 1, 1977
2.705
+0.324
13.63%
jan 1, 1978
3.013
+0.308
11.38%
jan 1, 1979
3.305
+0.292
9.69%
jan 1, 1980
3.582
+0.277
8.38%
jan 1, 1981
3.845
+0.263
7.33%
jan 1, 1982
4.094
+0.249
6.47%
jan 1, 1983
4.329
+0.236
5.76%
jan 1, 1984
4.552
+0.222
5.13%
jan 1, 1985
4.76
+0.208
4.58%
jan 1, 1986
4.954
+0.194
4.08%
jan 1, 1987
5.136
+0.182
3.66%
jan 1, 1988
5.305
+0.169
3.3%
jan 1, 1989
5.576
+0.271
5.11%
jan 1, 1990
5.881
+0.305
5.47%
jan 1, 1991
5.998
+0.116
1.98%
jan 1, 1992
6.291
+0.293
4.89%
jan 1, 1993
6.409
+0.118
1.87%
jan 1, 1994
6.642
+0.233
3.63%
jan 1, 1995
7.437
+0.796
11.98%
jan 1, 1996
7.648
+0.211
2.83%
jan 1, 1997
7.925
+0.277
3.62%
jan 1, 1998
8.164
+0.24
3.02%
jan 1, 1999
8.055
-0.109
-1.34%
jan 1, 2000
8.066
+0.011
0.14%
jan 1, 2001
8.095
+0.029
0.36%
jan 1, 2002
8.516
+0.421
5.2%
jan 1, 2003
8.13
-0.386
-4.53%
jan 1, 2004
8.092
-0.039
-0.47%
jan 1, 2005
8.261
+0.169
2.09%
jan 1, 2006
8.385
+0.124
1.5%
jan 1, 2007
8.826
+0.442
5.27%
jan 1, 2008
9.431
+0.605
6.85%
jan 1, 2009
9.714
+0.283
3.0%
jan 1, 2010
9.928
+0.214
2.21%
jan 1, 2011
10.313
+0.385
3.88%
jan 1, 2012
10.711
+0.398
3.86%
jan 1, 2013
11.116
+0.404
3.77%
jan 1, 2014
11.488
+0.373
3.35%
jan 1, 2015
11.765
+0.277
2.41%
jan 1, 2016
12.059
+0.294
2.5%
Ranking of countries by current statistics by years


Comments: