29
/
en
AIzaSyAYiBZKx7MnpbEhh9jyipgxe19OcubqV5w
April 1, 2024
140360
Ghana
GHA
true
2
1
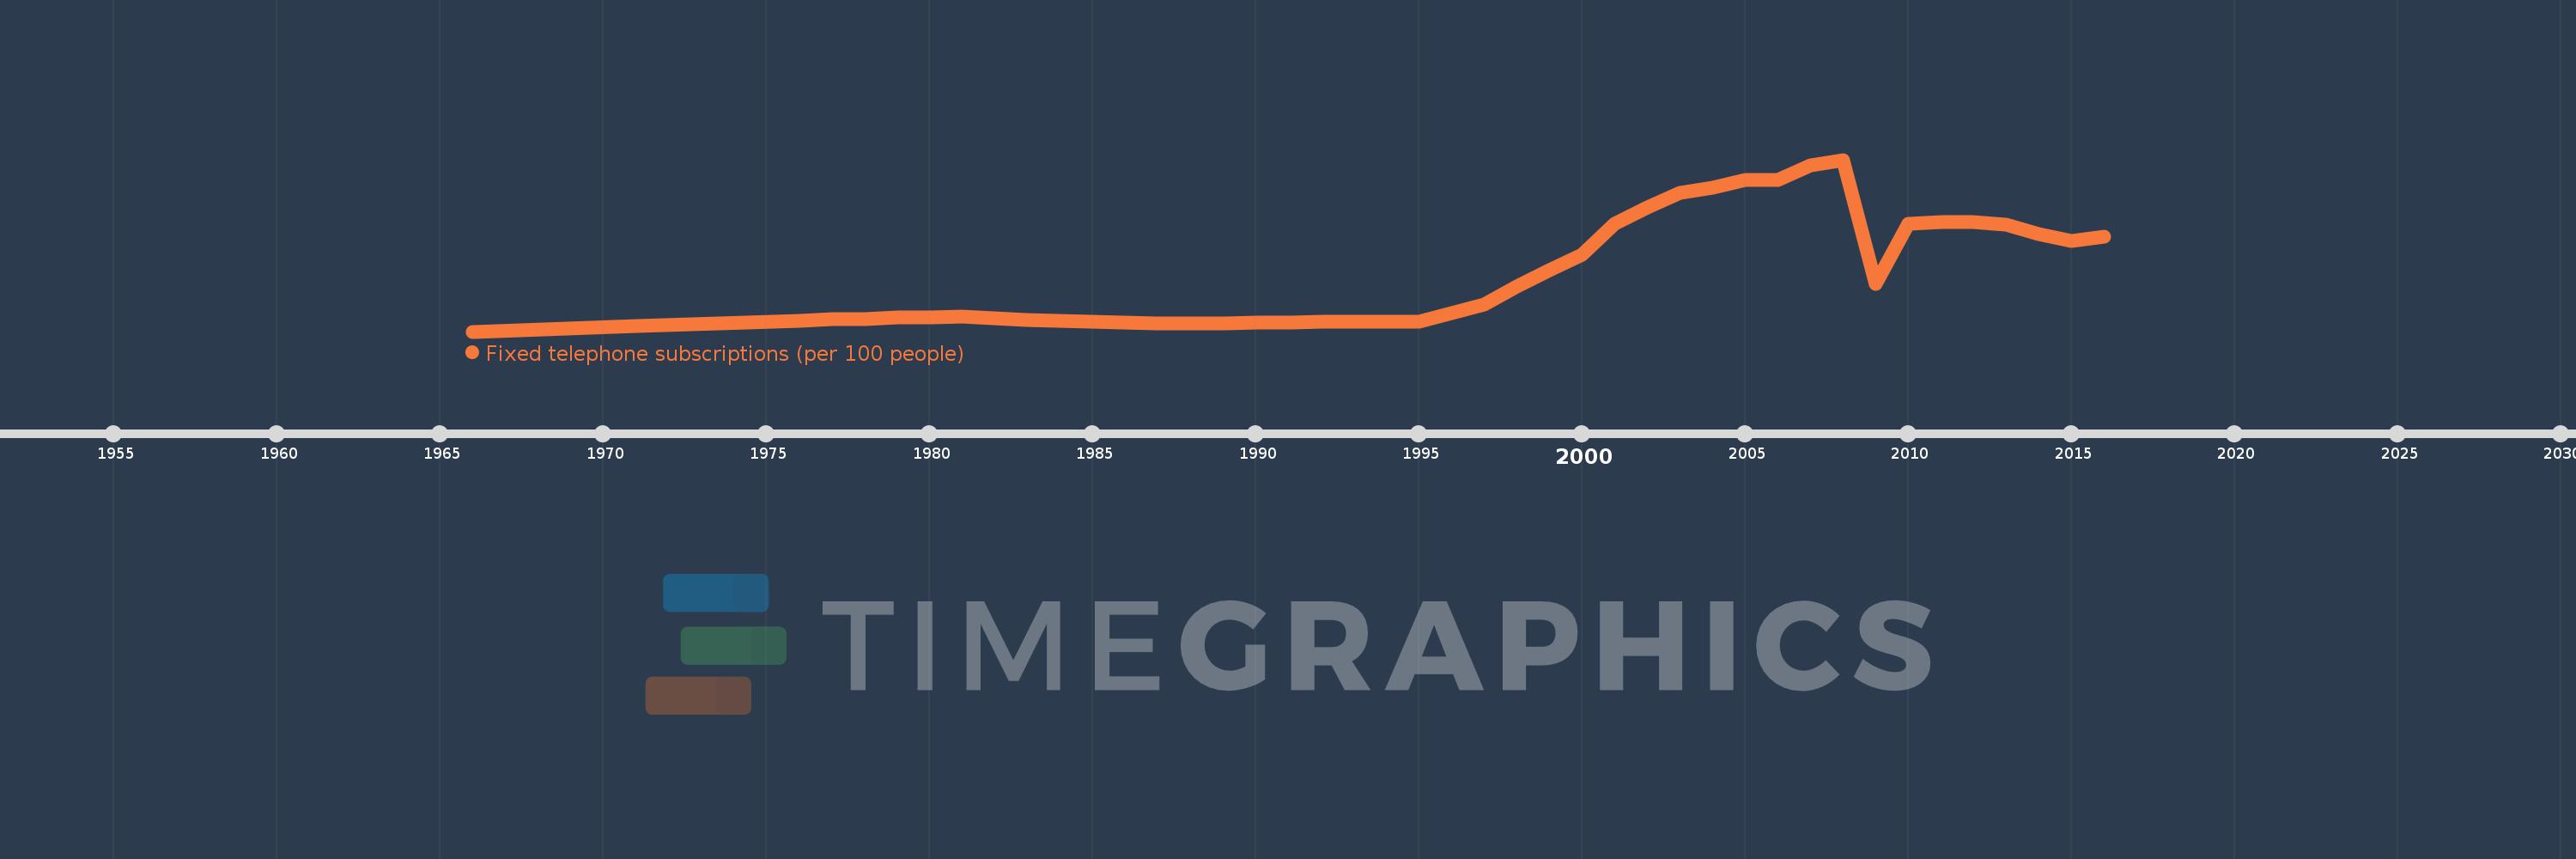
Fixed telephone subscriptions (per 100 people)
2016,2015,2014,2013,2012,2011,2010,2009,2008,2007,2006,2005,2004,2003,2002,2001,2000,1999,1998,1997,1996,1995,1994,1993,1992,1991,1990,1989,1988,1987,1986,1985,1984,1983,1982,1981,1980,1979,1978,1977,1976,1971,1966
This statistics in other country:
AfghanistanAlbaniaAlgeriaAmerican SamoaAndorraAngolaAntigua and BarbudaArab WorldArgentinaArmeniaArubaAustraliaAustriaAzerbaijanBahamas, TheBahrainBangladeshBarbadosBelarusBelgiumBelizeBeninBermudaBhutanBoliviaBosnia and HerzegovinaBotswanaBrazilBritish Virgin IslandsBrunei DarussalamBulgariaBurkina FasoBurundiCabo VerdeCambodiaCameroonCanadaCaribbean small statesCayman IslandsCentral African RepublicCentral Europe and the BalticsChadChileChinaColombiaComorosCongo, Dem. Rep.Congo, Rep.Costa RicaCote d'IvoireCroatiaCubaCuracaoCyprusCzech RepublicDenmarkDjiboutiDominicaDominican RepublicEarly-demographic dividendEast Asia & PacificEast Asia & Pacific (excluding high income)East Asia & Pacific (IDA & IBRD countries)EcuadorEgypt, Arab Rep.El SalvadorEquatorial GuineaEritreaEstoniaEthiopiaEuro areaEurope & Central AsiaEurope & Central Asia (excluding high income)Europe & Central Asia (IDA & IBRD countries)European UnionFaroe IslandsFijiFinlandFragile and conflict affected situationsFranceFrench PolynesiaGabonGambia, TheGeorgiaGermanyGhanaGibraltarGreeceGreenlandGrenadaGuamGuatemalaGuineaGuinea-BissauGuyanaHaitiHeavily indebted poor countries (HIPC)High incomeHondurasHong Kong SAR, ChinaHungaryIBRD onlyIcelandIDA & IBRD totalIDA blendIDA onlyIDA totalIndiaIndonesiaIran, Islamic Rep.IraqIrelandIsraelItalyJamaicaJapanJordanKazakhstanKenyaKiribatiKorea, Dem. People’s Rep.Korea, Rep.KosovoKuwaitKyrgyz RepublicLao PDRLate-demographic dividendLatin America & Caribbean Latin America & Caribbean (excluding high income)Latin America & the Caribbean (IDA & IBRD countries)LatviaLeast developed countries: UN classificationLebanonLesothoLiberiaLibyaLiechtensteinLithuaniaLow & middle incomeLow incomeLower middle incomeLuxembourgMacao SAR, ChinaMacedonia, FYRMadagascarMalawiMalaysiaMaldivesMaliMaltaMarshall IslandsMauritaniaMauritiusMexicoMicronesia, Fed. Sts.Middle East & North AfricaMiddle East & North Africa (excluding high income)Middle East & North Africa (IDA & IBRD countries)Middle incomeMoldovaMonacoMongoliaMontenegroMoroccoMozambiqueMyanmarNamibiaNauruNepalNetherlandsNew CaledoniaNew ZealandNicaraguaNigerNigeriaNorth AmericaNorthern Mariana IslandsNorwayOECD membersOmanOther small statesPacific island small statesPakistanPalauPanamaPapua New GuineaParaguayPeruPhilippinesPolandPortugalPost-demographic dividendPre-demographic dividendPuerto RicoQatarRomaniaRussian FederationRwandaSamoaSan MarinoSao Tome and PrincipeSaudi ArabiaSenegalSerbiaSeychellesSierra LeoneSingaporeSlovak RepublicSloveniaSmall statesSolomon IslandsSomaliaSouth AfricaSouth AsiaSouth Asia (IDA & IBRD)South SudanSpainSri LankaSt. Kitts and NevisSt. LuciaSt. Vincent and the GrenadinesSub-Saharan Africa Sub-Saharan Africa (excluding high income)Sub-Saharan Africa (IDA & IBRD countries)SudanSurinameSwazilandSwedenSwitzerlandSyrian Arab RepublicTajikistanTanzaniaThailandTimor-LesteTogoTongaTrinidad and TobagoTunisiaTurkeyTurkmenistanTurks and Caicos IslandsTuvaluUgandaUkraineUnited Arab EmiratesUnited KingdomUnited StatesUpper middle incomeUruguayUzbekistanVanuatuVenezuela, RBVietnamVirgin Islands (U.S.)West Bank and GazaWorldYemen, Rep.ZambiaZimbabwe Timeline:
This timeline shows a graph from 1966 to 2016 of Ghana. No data until 1965. Number of actual observations by date: 43.
Source name:
World Development Indicators
Source organization:
International Telecommunication Union, World Telecommunication/ICT Development Report and database.
Categories, topics:
Infrastructure
Last updated:
apr 23, 2017
Indicators value changes by year
At the date of observation
Value
Absolute change
Change from previous value
jan 1, 1966
0.224
+0.224
0.0%
jan 1, 1971
0.272
+0.048
21.31%
jan 1, 1976
0.318
+0.046
16.81%
jan 1, 1977
0.329
+0.011
3.48%
jan 1, 1978
0.332
+0.003
0.93%
jan 1, 1979
0.342
+0.01
2.94%
jan 1, 1980
0.345
+0.003
0.94%
jan 1, 1981
0.349
+0.004
1.13%
jan 1, 1982
0.334
-0.015
-4.36%
jan 1, 1983
0.323
-0.01
-3.1%
jan 1, 1984
0.312
-0.011
-3.48%
jan 1, 1985
0.309
-0.003
-0.84%
jan 1, 1986
0.301
-0.009
-2.84%
jan 1, 1987
0.294
-0.007
-2.37%
jan 1, 1988
0.294
+0.0
0.08%
jan 1, 1989
0.292
-0.002
-0.64%
jan 1, 1990
0.302
+0.01
3.54%
jan 1, 1991
0.302
+0.0
0.06%
jan 1, 1992
0.31
+0.007
2.45%
jan 1, 1993
0.309
-0.001
-0.38%
jan 1, 1994
0.306
-0.003
-0.86%
jan 1, 1995
0.306
+0.0
0.01%
jan 1, 1996
0.376
+0.07
22.94%
jan 1, 1997
0.454
+0.077
20.56%
jan 1, 1998
0.601
+0.147
32.42%
jan 1, 1999
0.743
+0.142
23.61%
jan 1, 2000
0.874
+0.132
17.72%
jan 1, 2001
1.129
+0.255
29.17%
jan 1, 2002
1.268
+0.139
12.3%
jan 1, 2003
1.39
+0.122
9.63%
jan 1, 2004
1.434
+0.043
3.13%
jan 1, 2005
1.504
+0.07
4.9%
jan 1, 2006
1.504
0.0
-0.02%
jan 1, 2007
1.624
+0.12
7.99%
jan 1, 2008
1.671
+0.048
2.95%
jan 1, 2009
0.623
-1.049
-62.75%
jan 1, 2010
1.129
+0.506
81.26%
jan 1, 2011
1.145
+0.017
1.48%
jan 1, 2012
1.147
+0.002
0.15%
jan 1, 2013
1.123
-0.024
-2.06%
jan 1, 2014
1.044
-0.08
-7.08%
jan 1, 2015
0.985
-0.059
-5.66%
jan 1, 2016
1.021
+0.036
3.7%
Ranking of countries by current statistics by years


Comments: