29
/
en
AIzaSyAYiBZKx7MnpbEhh9jyipgxe19OcubqV5w
April 1, 2024
37340
IDA & IBRD total
IBT
false
2
1
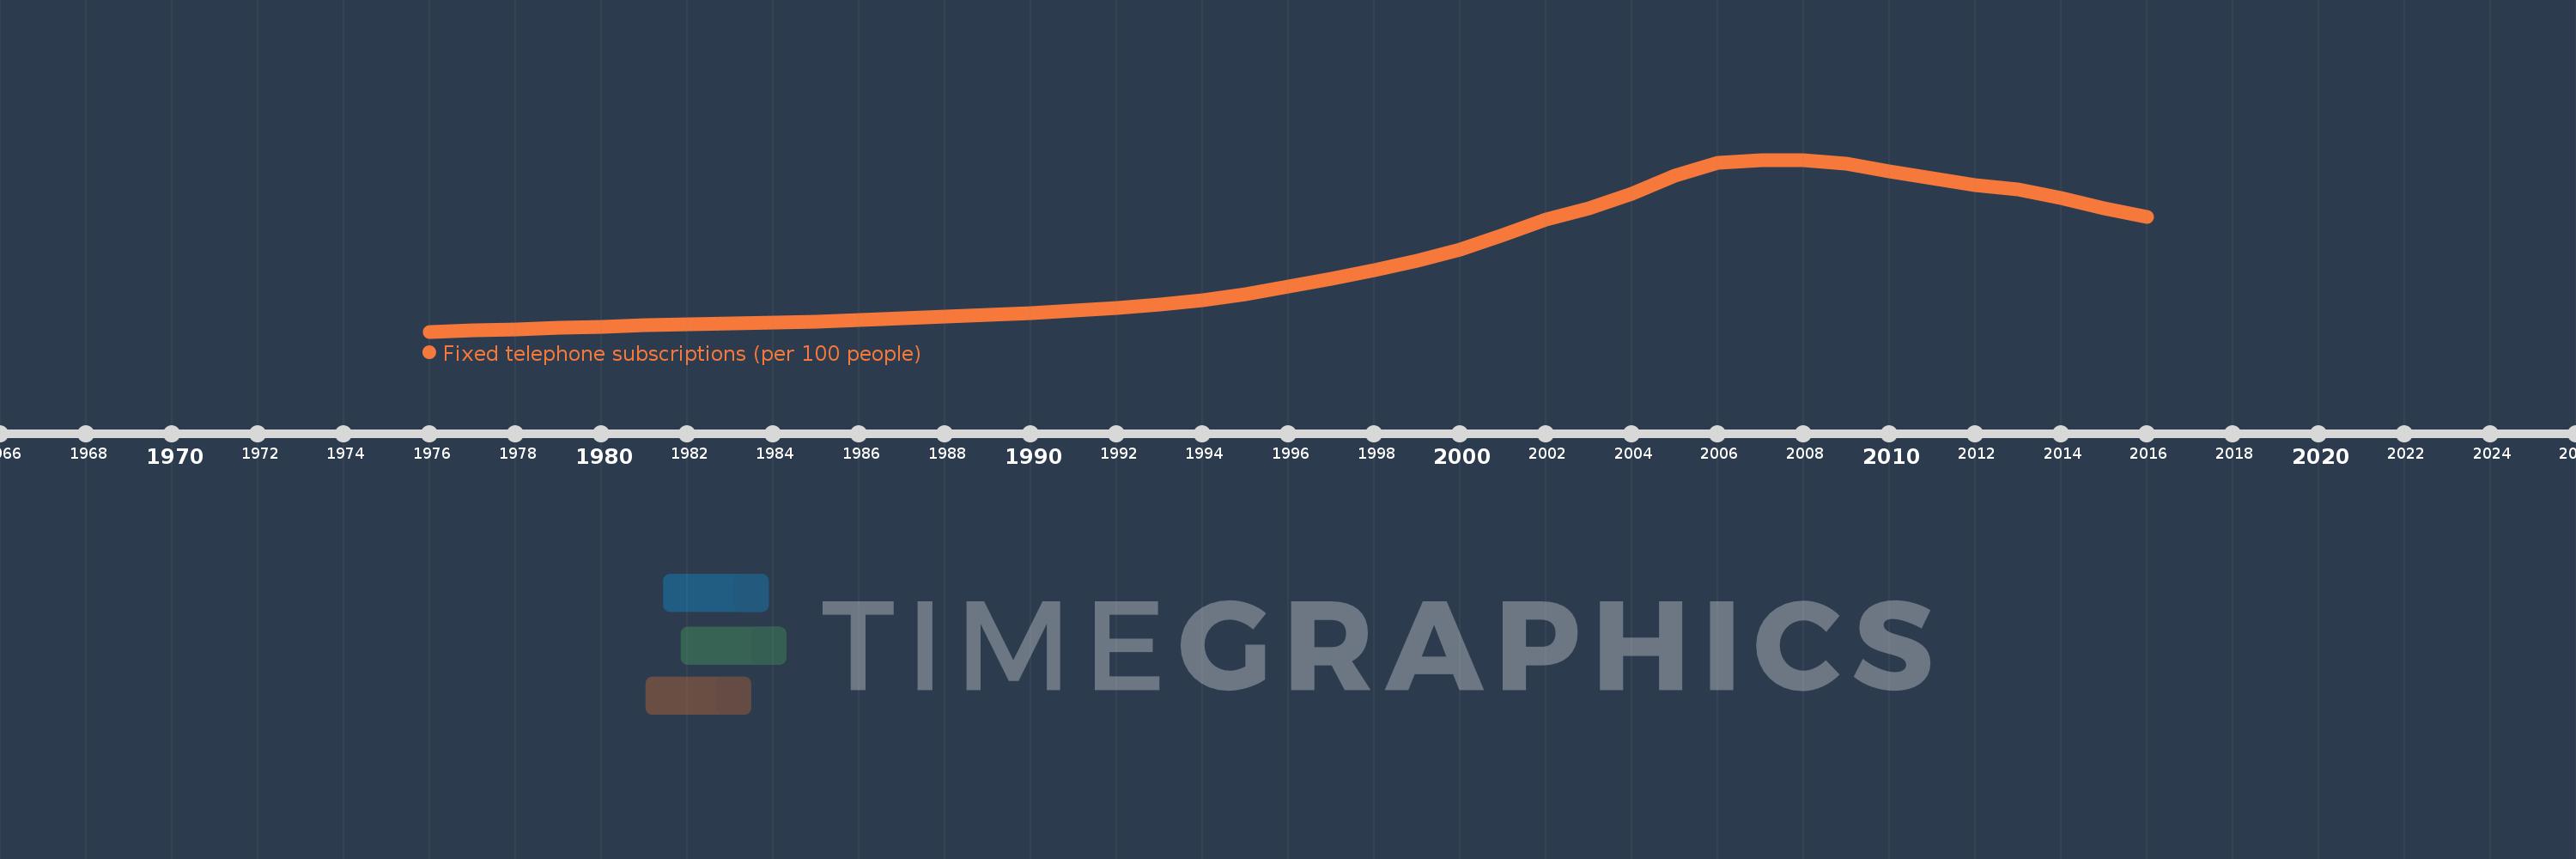
Fixed telephone subscriptions (per 100 people)
2016,2015,2014,2013,2012,2011,2010,2009,2008,2007,2006,2005,2004,2003,2002,2001,2000,1999,1998,1997,1996,1995,1994,1993,1992,1991,1990,1989,1988,1987,1986,1985,1984,1983,1982,1981,1980,1979,1978,1977,1976
This statistics in other country:
AfghanistanAlbaniaAlgeriaAmerican SamoaAndorraAngolaAntigua and BarbudaArab WorldArgentinaArmeniaArubaAustraliaAustriaAzerbaijanBahamas, TheBahrainBangladeshBarbadosBelarusBelgiumBelizeBeninBermudaBhutanBoliviaBosnia and HerzegovinaBotswanaBrazilBritish Virgin IslandsBrunei DarussalamBulgariaBurkina FasoBurundiCabo VerdeCambodiaCameroonCanadaCaribbean small statesCayman IslandsCentral African RepublicCentral Europe and the BalticsChadChileChinaColombiaComorosCongo, Dem. Rep.Congo, Rep.Costa RicaCote d'IvoireCroatiaCubaCuracaoCyprusCzech RepublicDenmarkDjiboutiDominicaDominican RepublicEarly-demographic dividendEast Asia & PacificEast Asia & Pacific (excluding high income)East Asia & Pacific (IDA & IBRD countries)EcuadorEgypt, Arab Rep.El SalvadorEquatorial GuineaEritreaEstoniaEthiopiaEuro areaEurope & Central AsiaEurope & Central Asia (excluding high income)Europe & Central Asia (IDA & IBRD countries)European UnionFaroe IslandsFijiFinlandFragile and conflict affected situationsFranceFrench PolynesiaGabonGambia, TheGeorgiaGermanyGhanaGibraltarGreeceGreenlandGrenadaGuamGuatemalaGuineaGuinea-BissauGuyanaHaitiHeavily indebted poor countries (HIPC)High incomeHondurasHong Kong SAR, ChinaHungaryIBRD onlyIcelandIDA & IBRD totalIDA blendIDA onlyIDA totalIndiaIndonesiaIran, Islamic Rep.IraqIrelandIsraelItalyJamaicaJapanJordanKazakhstanKenyaKiribatiKorea, Dem. People’s Rep.Korea, Rep.KosovoKuwaitKyrgyz RepublicLao PDRLate-demographic dividendLatin America & Caribbean Latin America & Caribbean (excluding high income)Latin America & the Caribbean (IDA & IBRD countries)LatviaLeast developed countries: UN classificationLebanonLesothoLiberiaLibyaLiechtensteinLithuaniaLow & middle incomeLow incomeLower middle incomeLuxembourgMacao SAR, ChinaMacedonia, FYRMadagascarMalawiMalaysiaMaldivesMaliMaltaMarshall IslandsMauritaniaMauritiusMexicoMicronesia, Fed. Sts.Middle East & North AfricaMiddle East & North Africa (excluding high income)Middle East & North Africa (IDA & IBRD countries)Middle incomeMoldovaMonacoMongoliaMontenegroMoroccoMozambiqueMyanmarNamibiaNauruNepalNetherlandsNew CaledoniaNew ZealandNicaraguaNigerNigeriaNorth AmericaNorthern Mariana IslandsNorwayOECD membersOmanOther small statesPacific island small statesPakistanPalauPanamaPapua New GuineaParaguayPeruPhilippinesPolandPortugalPost-demographic dividendPre-demographic dividendPuerto RicoQatarRomaniaRussian FederationRwandaSamoaSan MarinoSao Tome and PrincipeSaudi ArabiaSenegalSerbiaSeychellesSierra LeoneSingaporeSlovak RepublicSloveniaSmall statesSolomon IslandsSomaliaSouth AfricaSouth AsiaSouth Asia (IDA & IBRD)South SudanSpainSri LankaSt. Kitts and NevisSt. LuciaSt. Vincent and the GrenadinesSub-Saharan Africa Sub-Saharan Africa (excluding high income)Sub-Saharan Africa (IDA & IBRD countries)SudanSurinameSwazilandSwedenSwitzerlandSyrian Arab RepublicTajikistanTanzaniaThailandTimor-LesteTogoTongaTrinidad and TobagoTunisiaTurkeyTurkmenistanTurks and Caicos IslandsTuvaluUgandaUkraineUnited Arab EmiratesUnited KingdomUnited StatesUpper middle incomeUruguayUzbekistanVanuatuVenezuela, RBVietnamVirgin Islands (U.S.)West Bank and GazaWorldYemen, Rep.ZambiaZimbabwe Timeline:
This timeline shows a graph from 1976 to 2016 of IDA & IBRD total. No data until 1975. Number of actual observations by date: 41.
Source name:
World Development Indicators
Source organization:
International Telecommunication Union, World Telecommunication/ICT Development Report and database.
Categories, topics:
Infrastructure
Last updated:
apr 23, 2017
Indicators value changes by year
Maximum:
13.324
jan 1, 2008
At the date of observation
Value
Absolute change
Change from previous value
jan 1, 1977
1.068
+0.067
6.74%
jan 1, 1978
1.164
+0.096
8.97%
jan 1, 1979
1.253
+0.089
7.65%
jan 1, 1980
1.354
+0.101
8.06%
jan 1, 1981
1.449
+0.095
7.06%
jan 1, 1982
1.508
+0.058
4.03%
jan 1, 1983
1.559
+0.051
3.39%
jan 1, 1984
1.64
+0.082
5.25%
jan 1, 1985
1.734
+0.094
5.71%
jan 1, 1986
1.838
+0.104
5.99%
jan 1, 1987
1.943
+0.105
5.73%
jan 1, 1988
2.05
+0.107
5.49%
jan 1, 1989
2.19
+0.14
6.82%
jan 1, 1990
2.328
+0.138
6.31%
jan 1, 1991
2.489
+0.161
6.91%
jan 1, 1992
2.683
+0.194
7.78%
jan 1, 1993
2.921
+0.238
8.87%
jan 1, 1994
3.24
+0.32
10.94%
jan 1, 1995
3.681
+0.441
13.62%
jan 1, 1996
4.206
+0.524
14.24%
jan 1, 1997
4.794
+0.588
13.98%
jan 1, 1998
5.435
+0.641
13.37%
jan 1, 1999
6.089
+0.654
12.04%
jan 1, 2000
6.88
+0.791
12.99%
jan 1, 2001
7.963
+1.083
15.74%
jan 1, 2002
9.015
+1.052
13.21%
jan 1, 2003
9.867
+0.853
9.46%
jan 1, 2004
10.891
+1.024
10.38%
jan 1, 2005
12.204
+1.312
12.05%
jan 1, 2006
13.121
+0.918
7.52%
jan 1, 2007
13.291
+0.17
1.3%
jan 1, 2008
13.324
+0.033
0.25%
jan 1, 2009
13.07
-0.254
-1.91%
jan 1, 2010
12.499
-0.571
-4.37%
jan 1, 2011
11.982
-0.517
-4.14%
jan 1, 2012
11.535
-0.447
-3.73%
jan 1, 2013
11.178
-0.357
-3.1%
jan 1, 2014
10.556
-0.622
-5.56%
jan 1, 2015
9.831
-0.725
-6.87%
jan 1, 2016
9.226
-0.605
-6.15%
Ranking of countries by current statistics by years


Comments: