29
/
en
AIzaSyAYiBZKx7MnpbEhh9jyipgxe19OcubqV5w
April 1, 2024
152505
Hungary
HUN
true
2
1
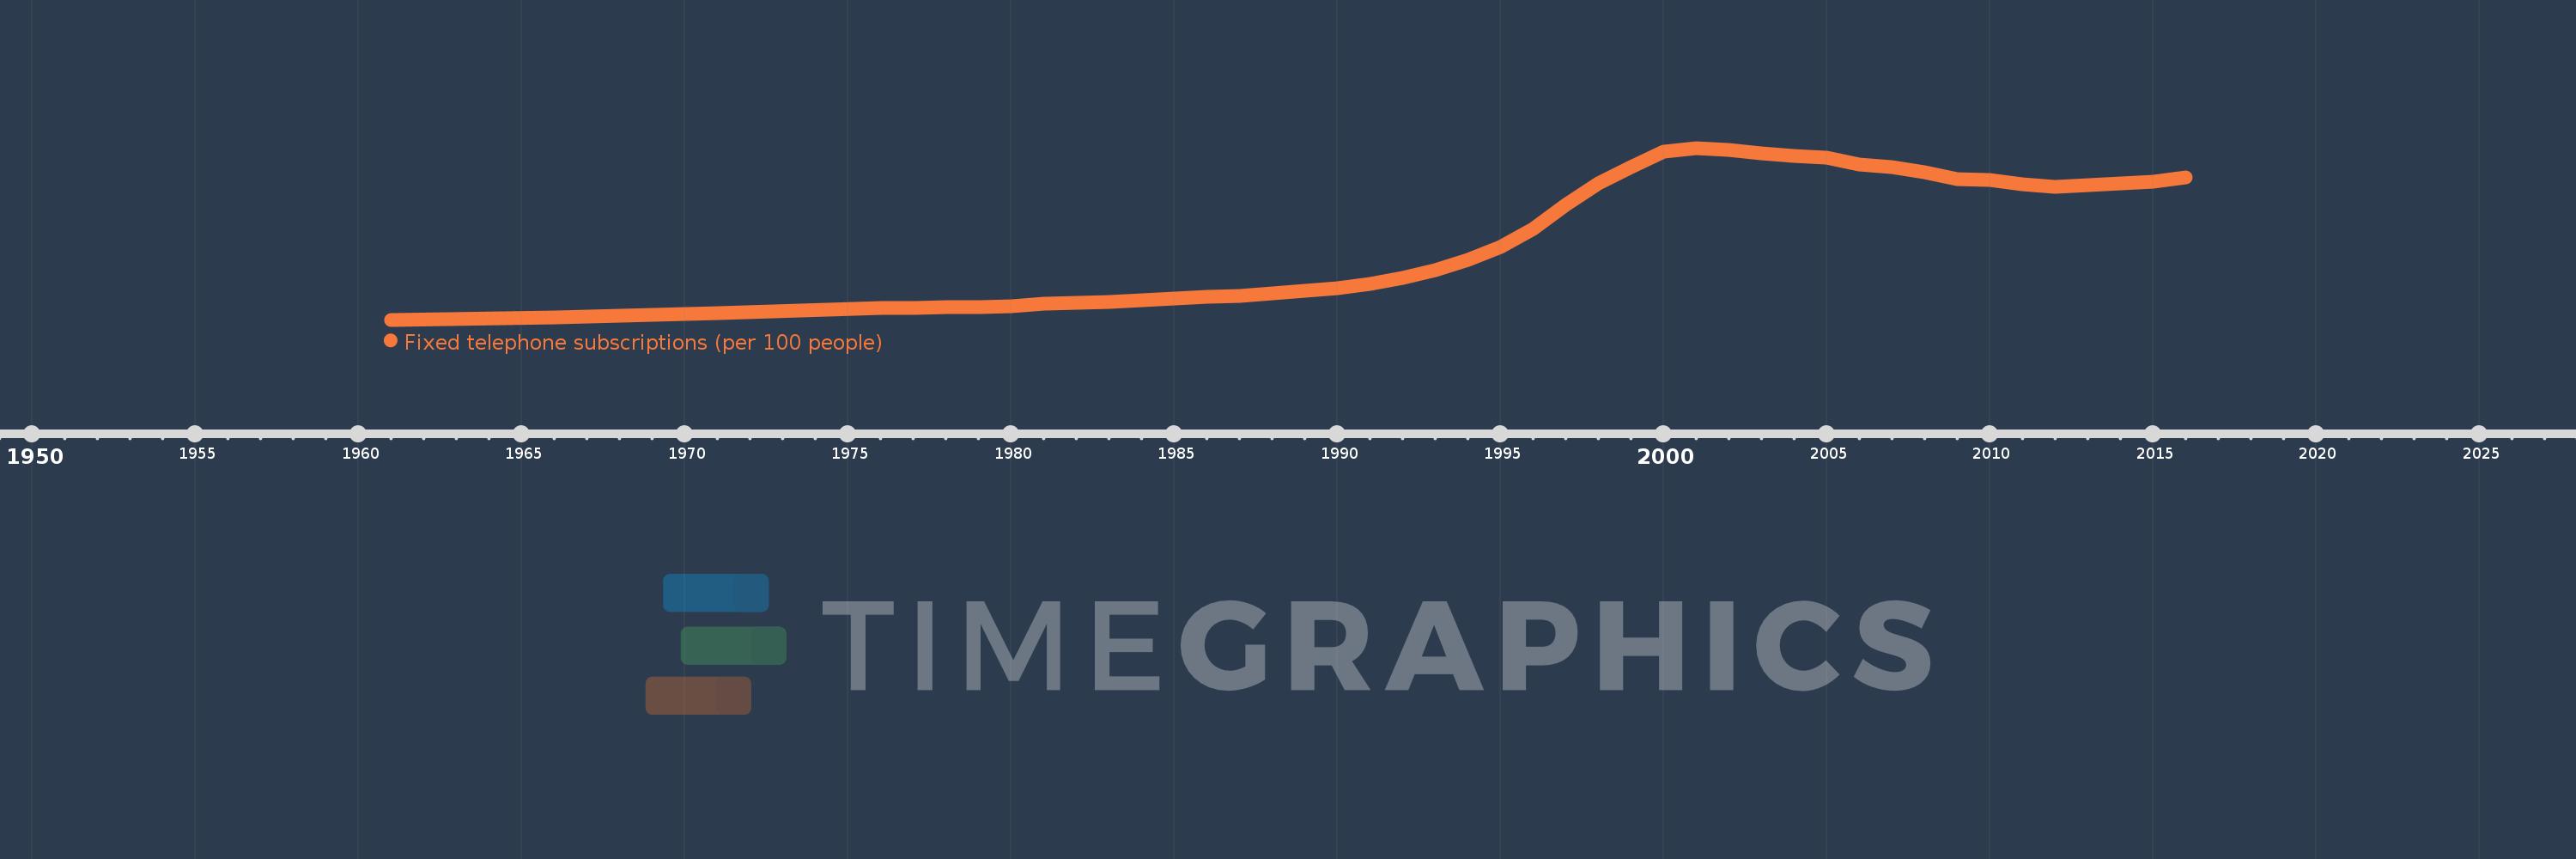
Fixed telephone subscriptions (per 100 people)
2016,2015,2014,2013,2012,2011,2010,2009,2008,2007,2006,2005,2004,2003,2002,2001,2000,1999,1998,1997,1996,1995,1994,1993,1992,1991,1990,1989,1988,1987,1986,1985,1984,1983,1982,1981,1980,1979,1978,1977,1976,1971,1966,1961
This statistics in other country:
AfghanistanAlbaniaAlgeriaAmerican SamoaAndorraAngolaAntigua and BarbudaArab WorldArgentinaArmeniaArubaAustraliaAustriaAzerbaijanBahamas, TheBahrainBangladeshBarbadosBelarusBelgiumBelizeBeninBermudaBhutanBoliviaBosnia and HerzegovinaBotswanaBrazilBritish Virgin IslandsBrunei DarussalamBulgariaBurkina FasoBurundiCabo VerdeCambodiaCameroonCanadaCaribbean small statesCayman IslandsCentral African RepublicCentral Europe and the BalticsChadChileChinaColombiaComorosCongo, Dem. Rep.Congo, Rep.Costa RicaCote d'IvoireCroatiaCubaCuracaoCyprusCzech RepublicDenmarkDjiboutiDominicaDominican RepublicEarly-demographic dividendEast Asia & PacificEast Asia & Pacific (excluding high income)East Asia & Pacific (IDA & IBRD countries)EcuadorEgypt, Arab Rep.El SalvadorEquatorial GuineaEritreaEstoniaEthiopiaEuro areaEurope & Central AsiaEurope & Central Asia (excluding high income)Europe & Central Asia (IDA & IBRD countries)European UnionFaroe IslandsFijiFinlandFragile and conflict affected situationsFranceFrench PolynesiaGabonGambia, TheGeorgiaGermanyGhanaGibraltarGreeceGreenlandGrenadaGuamGuatemalaGuineaGuinea-BissauGuyanaHaitiHeavily indebted poor countries (HIPC)High incomeHondurasHong Kong SAR, ChinaHungaryIBRD onlyIcelandIDA & IBRD totalIDA blendIDA onlyIDA totalIndiaIndonesiaIran, Islamic Rep.IraqIrelandIsraelItalyJamaicaJapanJordanKazakhstanKenyaKiribatiKorea, Dem. People’s Rep.Korea, Rep.KosovoKuwaitKyrgyz RepublicLao PDRLate-demographic dividendLatin America & Caribbean Latin America & Caribbean (excluding high income)Latin America & the Caribbean (IDA & IBRD countries)LatviaLeast developed countries: UN classificationLebanonLesothoLiberiaLibyaLiechtensteinLithuaniaLow & middle incomeLow incomeLower middle incomeLuxembourgMacao SAR, ChinaMacedonia, FYRMadagascarMalawiMalaysiaMaldivesMaliMaltaMarshall IslandsMauritaniaMauritiusMexicoMicronesia, Fed. Sts.Middle East & North AfricaMiddle East & North Africa (excluding high income)Middle East & North Africa (IDA & IBRD countries)Middle incomeMoldovaMonacoMongoliaMontenegroMoroccoMozambiqueMyanmarNamibiaNauruNepalNetherlandsNew CaledoniaNew ZealandNicaraguaNigerNigeriaNorth AmericaNorthern Mariana IslandsNorwayOECD membersOmanOther small statesPacific island small statesPakistanPalauPanamaPapua New GuineaParaguayPeruPhilippinesPolandPortugalPost-demographic dividendPre-demographic dividendPuerto RicoQatarRomaniaRussian FederationRwandaSamoaSan MarinoSao Tome and PrincipeSaudi ArabiaSenegalSerbiaSeychellesSierra LeoneSingaporeSlovak RepublicSloveniaSmall statesSolomon IslandsSomaliaSouth AfricaSouth AsiaSouth Asia (IDA & IBRD)South SudanSpainSri LankaSt. Kitts and NevisSt. LuciaSt. Vincent and the GrenadinesSub-Saharan Africa Sub-Saharan Africa (excluding high income)Sub-Saharan Africa (IDA & IBRD countries)SudanSurinameSwazilandSwedenSwitzerlandSyrian Arab RepublicTajikistanTanzaniaThailandTimor-LesteTogoTongaTrinidad and TobagoTunisiaTurkeyTurkmenistanTurks and Caicos IslandsTuvaluUgandaUkraineUnited Arab EmiratesUnited KingdomUnited StatesUpper middle incomeUruguayUzbekistanVanuatuVenezuela, RBVietnamVirgin Islands (U.S.)West Bank and GazaWorldYemen, Rep.ZambiaZimbabwe Timeline:
This timeline shows a graph from 1961 to 2016 of Hungary. No data until 1960. Number of actual observations by date: 44.
Source name:
World Development Indicators
Source organization:
International Telecommunication Union, World Telecommunication/ICT Development Report and database.
Categories, topics:
Infrastructure
Last updated:
apr 23, 2017
Indicators value changes by year
At the date of observation
Value
Absolute change
Change from previous value
jan 1, 1961
2.434
+2.434
0.0%
jan 1, 1966
2.987
+0.553
22.72%
jan 1, 1971
3.857
+0.871
29.15%
jan 1, 1976
4.819
+0.962
24.94%
jan 1, 1977
4.88
+0.061
1.26%
jan 1, 1978
4.91
+0.03
0.62%
jan 1, 1979
4.979
+0.069
1.41%
jan 1, 1980
5.222
+0.243
4.88%
jan 1, 1981
5.737
+0.514
9.85%
jan 1, 1982
5.922
+0.185
3.23%
jan 1, 1983
6.112
+0.19
3.21%
jan 1, 1984
6.337
+0.225
3.68%
jan 1, 1985
6.641
+0.304
4.79%
jan 1, 1986
6.988
+0.347
5.23%
jan 1, 1987
7.316
+0.328
4.7%
jan 1, 1988
7.753
+0.437
5.98%
jan 1, 1989
8.218
+0.465
6.0%
jan 1, 1990
8.798
+0.58
7.06%
jan 1, 1991
9.589
+0.791
8.99%
jan 1, 1992
10.879
+1.289
13.45%
jan 1, 1993
12.457
+1.579
14.51%
jan 1, 1994
14.45
+1.993
16.0%
jan 1, 1995
17.123
+2.673
18.5%
jan 1, 1996
20.839
+3.716
21.7%
jan 1, 1997
25.653
+4.815
23.1%
jan 1, 1998
30.019
+4.366
17.02%
jan 1, 1999
33.288
+3.269
10.89%
jan 1, 2000
36.338
+3.05
9.16%
jan 1, 2001
37.15
+0.812
2.23%
jan 1, 2002
36.702
-0.448
-1.21%
jan 1, 2003
36.084
-0.618
-1.68%
jan 1, 2004
35.524
-0.56
-1.55%
jan 1, 2005
35.225
-0.299
-0.84%
jan 1, 2006
33.832
-1.392
-3.95%
jan 1, 2007
33.347
-0.486
-1.44%
jan 1, 2008
32.31
-1.037
-3.11%
jan 1, 2009
30.798
-1.512
-4.68%
jan 1, 2010
30.592
-0.206
-0.67%
jan 1, 2011
29.729
-0.863
-2.82%
jan 1, 2012
29.344
-0.385
-1.29%
jan 1, 2013
29.677
+0.333
1.13%
jan 1, 2014
29.915
+0.238
0.8%
jan 1, 2015
30.315
+0.4
1.34%
jan 1, 2016
31.219
+0.904
2.98%
Ranking of countries by current statistics by years


Comments: