29
/
en
AIzaSyAYiBZKx7MnpbEhh9jyipgxe19OcubqV5w
April 1, 2024
188995
Maldives
MDV
true
2
1
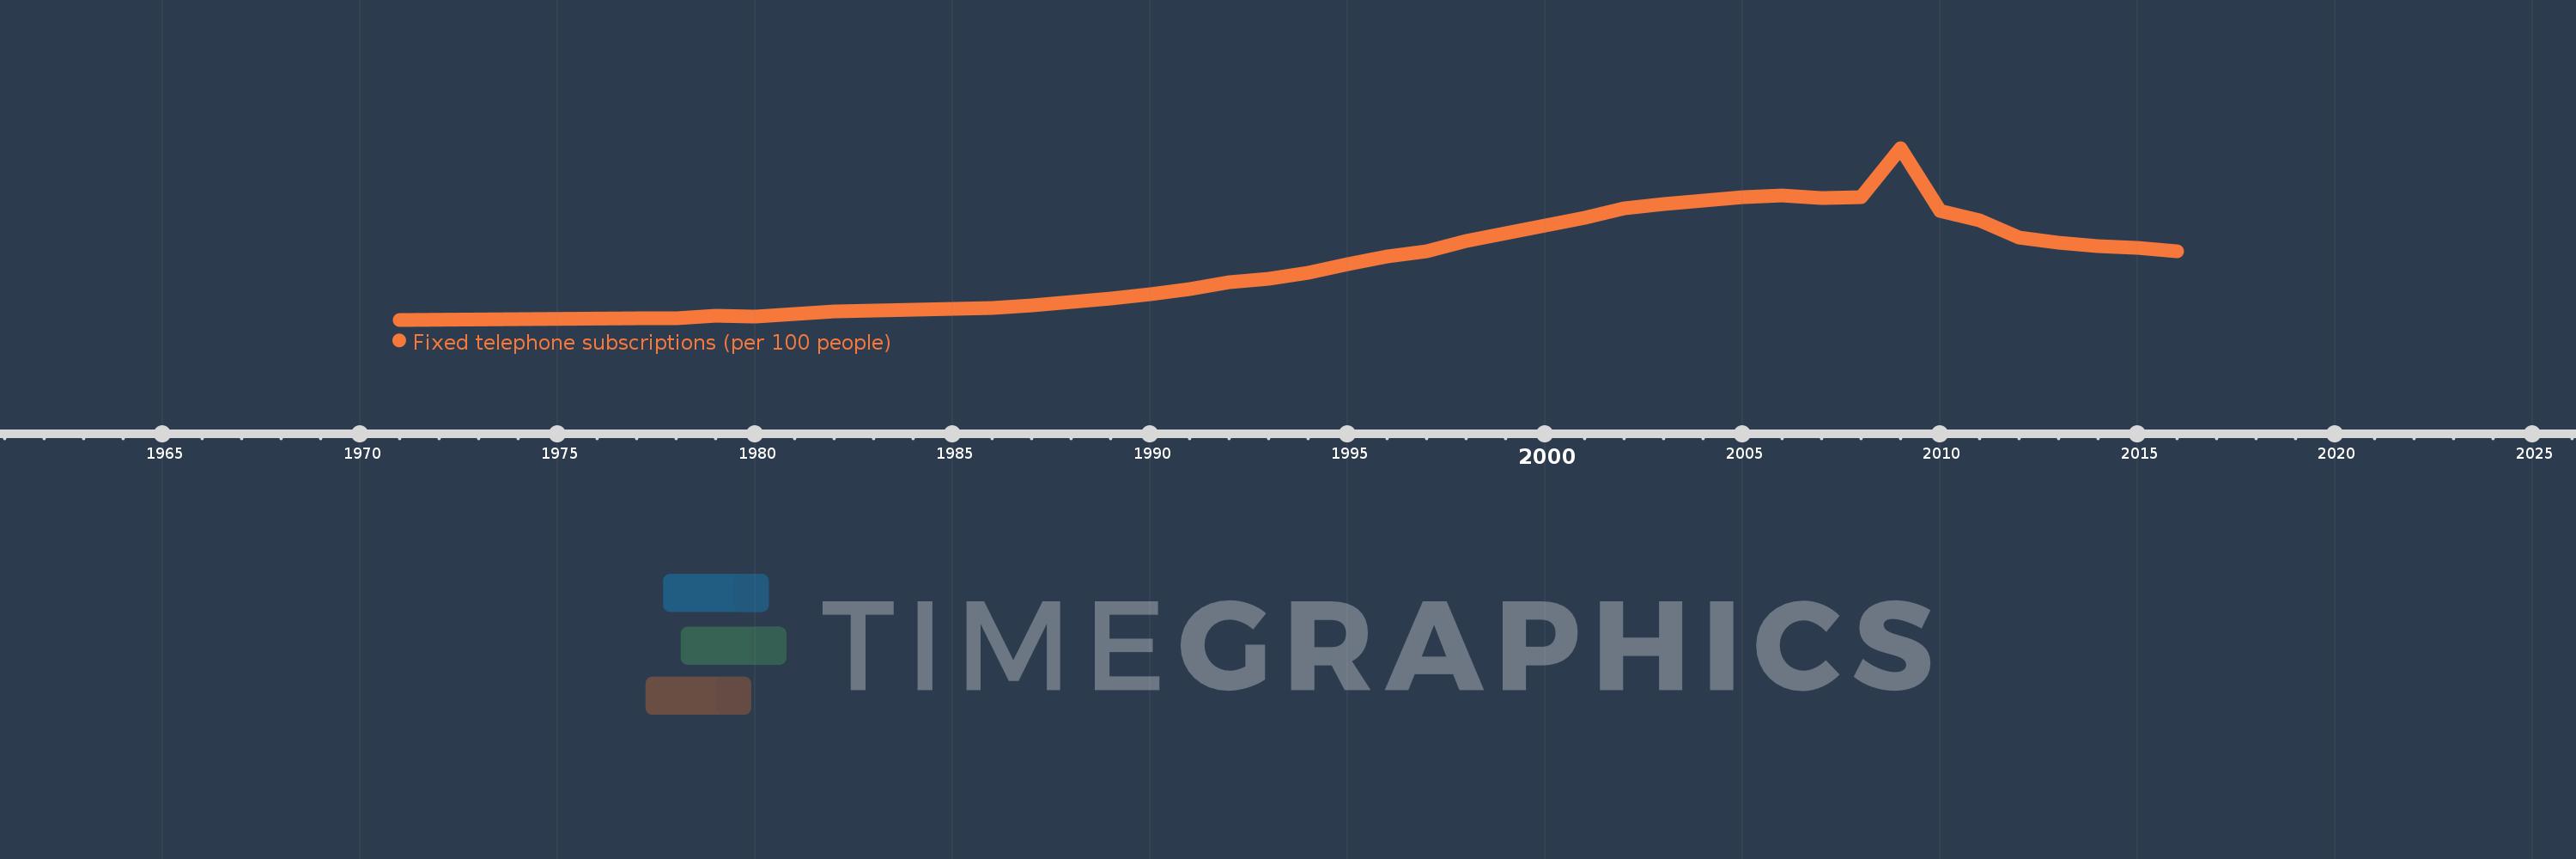
Fixed telephone subscriptions (per 100 people)
2016,2015,2014,2013,2012,2011,2010,2009,2008,2007,2006,2005,2004,2003,2002,2001,2000,1999,1998,1997,1996,1995,1994,1993,1992,1991,1990,1989,1988,1987,1986,1985,1984,1983,1982,1980,1979,1978,1977,1971
This statistics in other country:
AfghanistanAlbaniaAlgeriaAmerican SamoaAndorraAngolaAntigua and BarbudaArab WorldArgentinaArmeniaArubaAustraliaAustriaAzerbaijanBahamas, TheBahrainBangladeshBarbadosBelarusBelgiumBelizeBeninBermudaBhutanBoliviaBosnia and HerzegovinaBotswanaBrazilBritish Virgin IslandsBrunei DarussalamBulgariaBurkina FasoBurundiCabo VerdeCambodiaCameroonCanadaCaribbean small statesCayman IslandsCentral African RepublicCentral Europe and the BalticsChadChileChinaColombiaComorosCongo, Dem. Rep.Congo, Rep.Costa RicaCote d'IvoireCroatiaCubaCuracaoCyprusCzech RepublicDenmarkDjiboutiDominicaDominican RepublicEarly-demographic dividendEast Asia & PacificEast Asia & Pacific (excluding high income)East Asia & Pacific (IDA & IBRD countries)EcuadorEgypt, Arab Rep.El SalvadorEquatorial GuineaEritreaEstoniaEthiopiaEuro areaEurope & Central AsiaEurope & Central Asia (excluding high income)Europe & Central Asia (IDA & IBRD countries)European UnionFaroe IslandsFijiFinlandFragile and conflict affected situationsFranceFrench PolynesiaGabonGambia, TheGeorgiaGermanyGhanaGibraltarGreeceGreenlandGrenadaGuamGuatemalaGuineaGuinea-BissauGuyanaHaitiHeavily indebted poor countries (HIPC)High incomeHondurasHong Kong SAR, ChinaHungaryIBRD onlyIcelandIDA & IBRD totalIDA blendIDA onlyIDA totalIndiaIndonesiaIran, Islamic Rep.IraqIrelandIsraelItalyJamaicaJapanJordanKazakhstanKenyaKiribatiKorea, Dem. People’s Rep.Korea, Rep.KosovoKuwaitKyrgyz RepublicLao PDRLate-demographic dividendLatin America & Caribbean Latin America & Caribbean (excluding high income)Latin America & the Caribbean (IDA & IBRD countries)LatviaLeast developed countries: UN classificationLebanonLesothoLiberiaLibyaLiechtensteinLithuaniaLow & middle incomeLow incomeLower middle incomeLuxembourgMacao SAR, ChinaMacedonia, FYRMadagascarMalawiMalaysiaMaldivesMaliMaltaMarshall IslandsMauritaniaMauritiusMexicoMicronesia, Fed. Sts.Middle East & North AfricaMiddle East & North Africa (excluding high income)Middle East & North Africa (IDA & IBRD countries)Middle incomeMoldovaMonacoMongoliaMontenegroMoroccoMozambiqueMyanmarNamibiaNauruNepalNetherlandsNew CaledoniaNew ZealandNicaraguaNigerNigeriaNorth AmericaNorthern Mariana IslandsNorwayOECD membersOmanOther small statesPacific island small statesPakistanPalauPanamaPapua New GuineaParaguayPeruPhilippinesPolandPortugalPost-demographic dividendPre-demographic dividendPuerto RicoQatarRomaniaRussian FederationRwandaSamoaSan MarinoSao Tome and PrincipeSaudi ArabiaSenegalSerbiaSeychellesSierra LeoneSingaporeSlovak RepublicSloveniaSmall statesSolomon IslandsSomaliaSouth AfricaSouth AsiaSouth Asia (IDA & IBRD)South SudanSpainSri LankaSt. Kitts and NevisSt. LuciaSt. Vincent and the GrenadinesSub-Saharan Africa Sub-Saharan Africa (excluding high income)Sub-Saharan Africa (IDA & IBRD countries)SudanSurinameSwazilandSwedenSwitzerlandSyrian Arab RepublicTajikistanTanzaniaThailandTimor-LesteTogoTongaTrinidad and TobagoTunisiaTurkeyTurkmenistanTurks and Caicos IslandsTuvaluUgandaUkraineUnited Arab EmiratesUnited KingdomUnited StatesUpper middle incomeUruguayUzbekistanVanuatuVenezuela, RBVietnamVirgin Islands (U.S.)West Bank and GazaWorldYemen, Rep.ZambiaZimbabwe Timeline:
This timeline shows a graph from 1971 to 2016 of Maldives. No data until 1970. Number of actual observations by date: 40.
Source name:
World Development Indicators
Source organization:
International Telecommunication Union, World Telecommunication/ICT Development Report and database.
Categories, topics:
Infrastructure
Last updated:
apr 23, 2017
Indicators value changes by year
Maximum:
14.952
jan 1, 2009
At the date of observation
Value
Absolute change
Change from previous value
jan 1, 1971
0.228
+0.228
0.0%
jan 1, 1977
0.341
+0.113
49.57%
jan 1, 1978
0.381
+0.04
11.84%
jan 1, 1979
0.584
+0.203
53.27%
jan 1, 1980
0.534
-0.05
-8.48%
jan 1, 1982
0.966
+0.431
80.72%
jan 1, 1983
1.03
+0.064
6.65%
jan 1, 1984
1.111
+0.081
7.87%
jan 1, 1985
1.185
+0.074
6.66%
jan 1, 1986
1.238
+0.053
4.46%
jan 1, 1987
1.474
+0.236
19.06%
jan 1, 1988
1.73
+0.256
17.39%
jan 1, 1989
2.068
+0.338
19.54%
jan 1, 1990
2.434
+0.366
17.68%
jan 1, 1991
2.891
+0.457
18.77%
jan 1, 1992
3.438
+0.547
18.93%
jan 1, 1993
3.74
+0.302
8.8%
jan 1, 1994
4.268
+0.527
14.1%
jan 1, 1995
4.956
+0.689
16.13%
jan 1, 1996
5.662
+0.705
14.23%
jan 1, 1997
6.091
+0.43
7.59%
jan 1, 1998
7.009
+0.918
15.07%
jan 1, 1999
7.629
+0.62
8.84%
jan 1, 2000
8.293
+0.664
8.7%
jan 1, 2001
8.958
+0.665
8.02%
jan 1, 2002
9.805
+0.848
9.46%
jan 1, 2003
10.133
+0.328
3.34%
jan 1, 2004
10.451
+0.318
3.13%
jan 1, 2005
10.77
+0.319
3.05%
jan 1, 2006
10.853
+0.083
0.77%
jan 1, 2007
10.627
-0.226
-2.08%
jan 1, 2008
10.726
+0.099
0.94%
jan 1, 2009
14.952
+4.225
39.39%
jan 1, 2010
9.538
-5.413
-36.21%
jan 1, 2011
8.712
-0.826
-8.66%
jan 1, 2012
7.255
-1.457
-16.73%
jan 1, 2013
6.837
-0.418
-5.76%
jan 1, 2014
6.538
-0.299
-4.38%
jan 1, 2015
6.414
-0.124
-1.9%
jan 1, 2016
6.121
-0.293
-4.57%
Ranking of countries by current statistics by years


Comments: