29
/
en
AIzaSyAYiBZKx7MnpbEhh9jyipgxe19OcubqV5w
April 1, 2024
282268
Vietnam
VNM
true
2
1
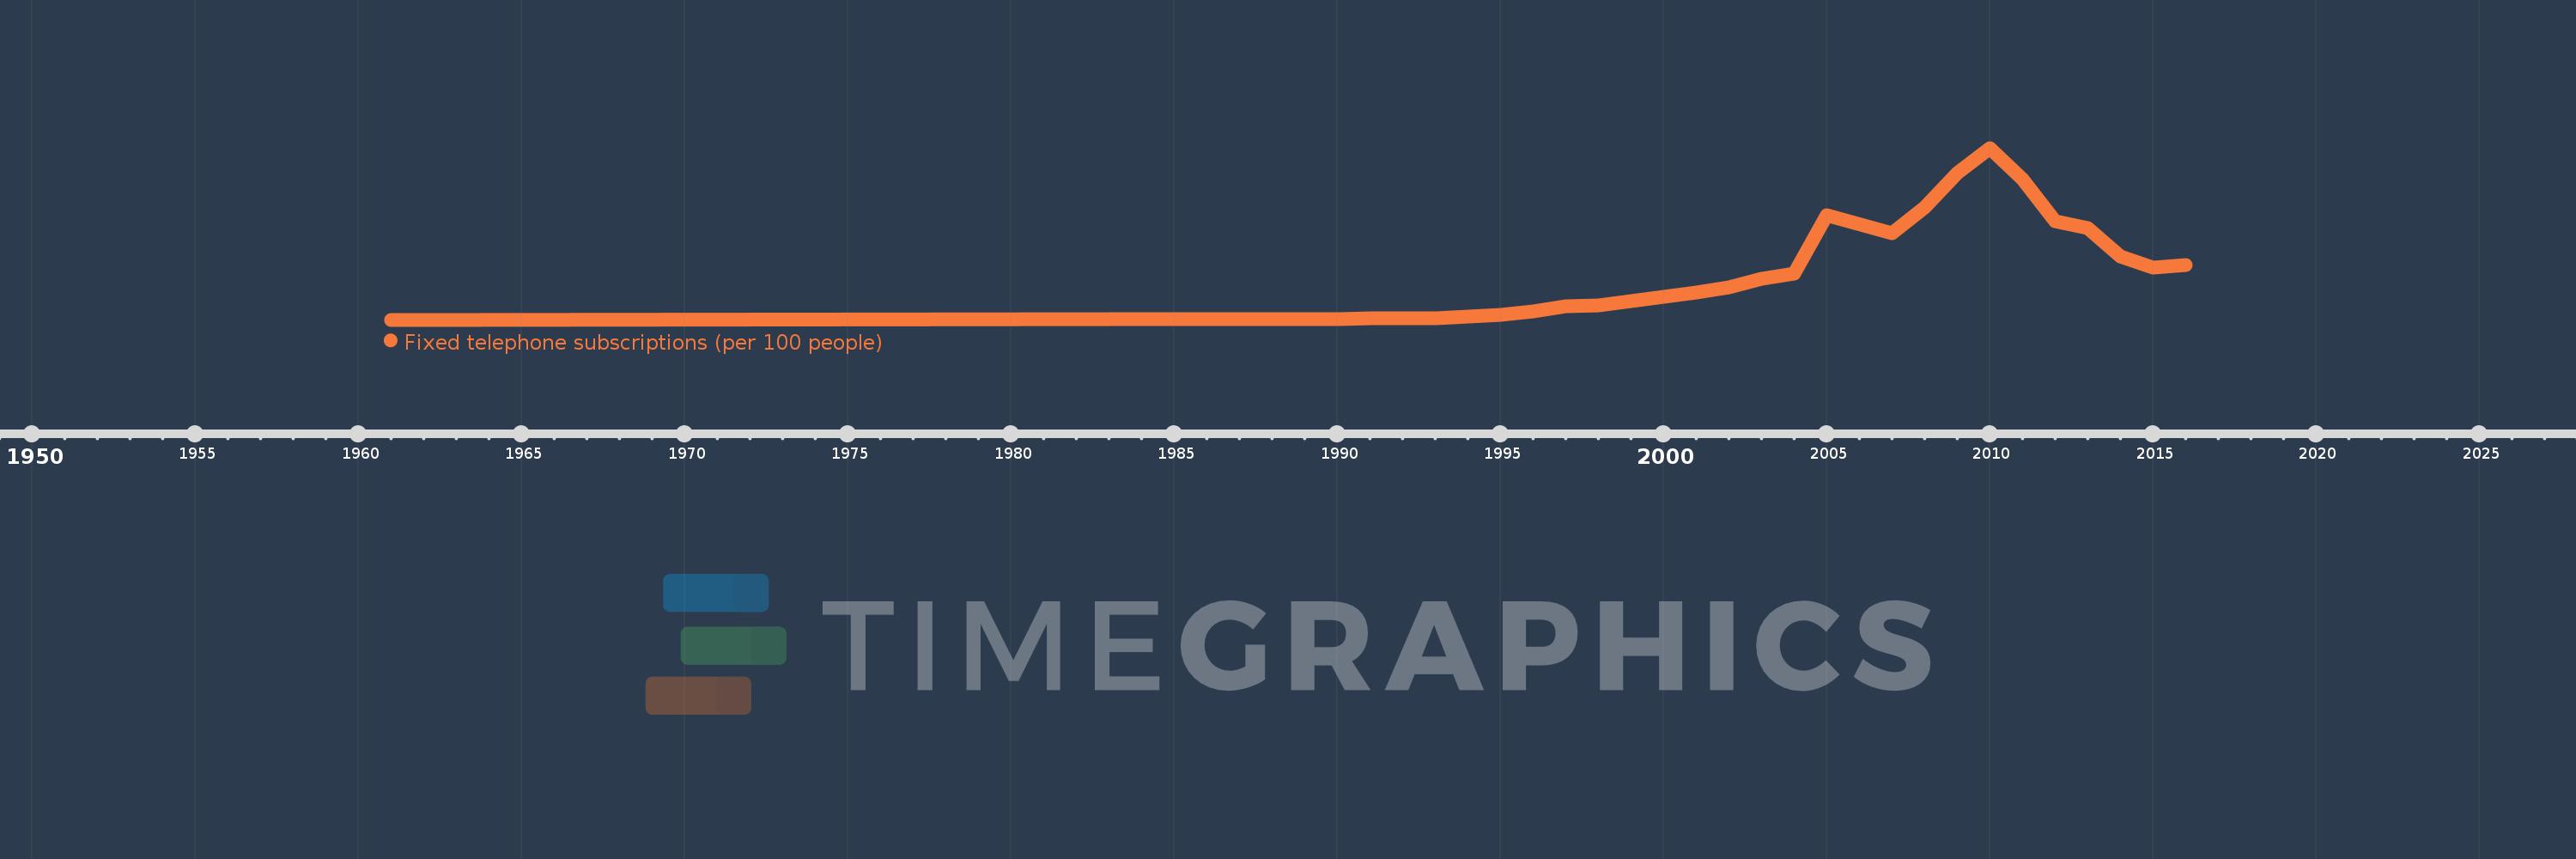
Fixed telephone subscriptions (per 100 people)
2016,2015,2014,2013,2012,2011,2010,2009,2008,2007,2005,2004,2003,2002,2001,2000,1999,1998,1997,1996,1995,1994,1993,1992,1991,1990,1989,1988,1987,1986,1985,1984,1983,1961
This statistics in other country:
AfghanistanAlbaniaAlgeriaAmerican SamoaAndorraAngolaAntigua and BarbudaArab WorldArgentinaArmeniaArubaAustraliaAustriaAzerbaijanBahamas, TheBahrainBangladeshBarbadosBelarusBelgiumBelizeBeninBermudaBhutanBoliviaBosnia and HerzegovinaBotswanaBrazilBritish Virgin IslandsBrunei DarussalamBulgariaBurkina FasoBurundiCabo VerdeCambodiaCameroonCanadaCaribbean small statesCayman IslandsCentral African RepublicCentral Europe and the BalticsChadChileChinaColombiaComorosCongo, Dem. Rep.Congo, Rep.Costa RicaCote d'IvoireCroatiaCubaCuracaoCyprusCzech RepublicDenmarkDjiboutiDominicaDominican RepublicEarly-demographic dividendEast Asia & PacificEast Asia & Pacific (excluding high income)East Asia & Pacific (IDA & IBRD countries)EcuadorEgypt, Arab Rep.El SalvadorEquatorial GuineaEritreaEstoniaEthiopiaEuro areaEurope & Central AsiaEurope & Central Asia (excluding high income)Europe & Central Asia (IDA & IBRD countries)European UnionFaroe IslandsFijiFinlandFragile and conflict affected situationsFranceFrench PolynesiaGabonGambia, TheGeorgiaGermanyGhanaGibraltarGreeceGreenlandGrenadaGuamGuatemalaGuineaGuinea-BissauGuyanaHaitiHeavily indebted poor countries (HIPC)High incomeHondurasHong Kong SAR, ChinaHungaryIBRD onlyIcelandIDA & IBRD totalIDA blendIDA onlyIDA totalIndiaIndonesiaIran, Islamic Rep.IraqIrelandIsraelItalyJamaicaJapanJordanKazakhstanKenyaKiribatiKorea, Dem. People’s Rep.Korea, Rep.KosovoKuwaitKyrgyz RepublicLao PDRLate-demographic dividendLatin America & Caribbean Latin America & Caribbean (excluding high income)Latin America & the Caribbean (IDA & IBRD countries)LatviaLeast developed countries: UN classificationLebanonLesothoLiberiaLibyaLiechtensteinLithuaniaLow & middle incomeLow incomeLower middle incomeLuxembourgMacao SAR, ChinaMacedonia, FYRMadagascarMalawiMalaysiaMaldivesMaliMaltaMarshall IslandsMauritaniaMauritiusMexicoMicronesia, Fed. Sts.Middle East & North AfricaMiddle East & North Africa (excluding high income)Middle East & North Africa (IDA & IBRD countries)Middle incomeMoldovaMonacoMongoliaMontenegroMoroccoMozambiqueMyanmarNamibiaNauruNepalNetherlandsNew CaledoniaNew ZealandNicaraguaNigerNigeriaNorth AmericaNorthern Mariana IslandsNorwayOECD membersOmanOther small statesPacific island small statesPakistanPalauPanamaPapua New GuineaParaguayPeruPhilippinesPolandPortugalPost-demographic dividendPre-demographic dividendPuerto RicoQatarRomaniaRussian FederationRwandaSamoaSan MarinoSao Tome and PrincipeSaudi ArabiaSenegalSerbiaSeychellesSierra LeoneSingaporeSlovak RepublicSloveniaSmall statesSolomon IslandsSomaliaSouth AfricaSouth AsiaSouth Asia (IDA & IBRD)South SudanSpainSri LankaSt. Kitts and NevisSt. LuciaSt. Vincent and the GrenadinesSub-Saharan Africa Sub-Saharan Africa (excluding high income)Sub-Saharan Africa (IDA & IBRD countries)SudanSurinameSwazilandSwedenSwitzerlandSyrian Arab RepublicTajikistanTanzaniaThailandTimor-LesteTogoTongaTrinidad and TobagoTunisiaTurkeyTurkmenistanTurks and Caicos IslandsTuvaluUgandaUkraineUnited Arab EmiratesUnited KingdomUnited StatesUpper middle incomeUruguayUzbekistanVanuatuVenezuela, RBVietnamVirgin Islands (U.S.)West Bank and GazaWorldYemen, Rep.ZambiaZimbabwe Timeline:
This timeline shows a graph from 1961 to 2016 of Vietnam. No data until 1960. Number of actual observations by date: 34.
Source name:
World Development Indicators
Source organization:
International Telecommunication Union, World Telecommunication/ICT Development Report and database.
Categories, topics:
Infrastructure
Last updated:
apr 23, 2017
Indicators value changes by year
Maximum:
19.759
jan 1, 2010
At the date of observation
Value
Absolute change
Change from previous value
jan 1, 1961
0.022
+0.022
0.0%
jan 1, 1983
0.113
+0.091
415.61%
jan 1, 1984
0.116
+0.002
2.19%
jan 1, 1985
0.116
+0.001
0.56%
jan 1, 1986
0.117
+0.001
0.5%
jan 1, 1987
0.12
+0.004
3.17%
jan 1, 1988
0.119
-0.001
-0.94%
jan 1, 1989
0.118
-0.001
-0.93%
jan 1, 1990
0.119
+0.0
0.34%
jan 1, 1991
0.143
+0.024
20.53%
jan 1, 1992
0.195
+0.052
36.22%
jan 1, 1993
0.212
+0.018
9.05%
jan 1, 1994
0.354
+0.142
66.84%
jan 1, 1995
0.591
+0.237
66.85%
jan 1, 1996
1.019
+0.428
72.4%
jan 1, 1997
1.537
+0.518
50.8%
jan 1, 1998
1.705
+0.167
10.87%
jan 1, 1999
2.203
+0.499
29.25%
jan 1, 2000
2.631
+0.428
19.44%
jan 1, 2001
3.144
+0.512
19.46%
jan 1, 2002
3.732
+0.588
18.71%
jan 1, 2003
4.76
+1.028
27.55%
jan 1, 2004
5.281
+0.521
10.95%
jan 1, 2005
12.032
+6.751
127.83%
jan 1, 2007
9.992
-2.04
-16.96%
jan 1, 2008
12.9
+2.909
29.11%
jan 1, 2009
16.903
+4.002
31.02%
jan 1, 2010
19.759
+2.856
16.9%
jan 1, 2011
16.142
-3.616
-18.3%
jan 1, 2012
11.316
-4.826
-29.9%
jan 1, 2013
10.525
-0.791
-6.99%
jan 1, 2014
7.336
-3.189
-30.3%
jan 1, 2015
6.01
-1.326
-18.07%
jan 1, 2016
6.318
+0.308
5.12%
Ranking of countries by current statistics by years


Comments: