29
/
en
AIzaSyAYiBZKx7MnpbEhh9jyipgxe19OcubqV5w
April 1, 2024
117876
Czech Republic
CZE
true
2
1
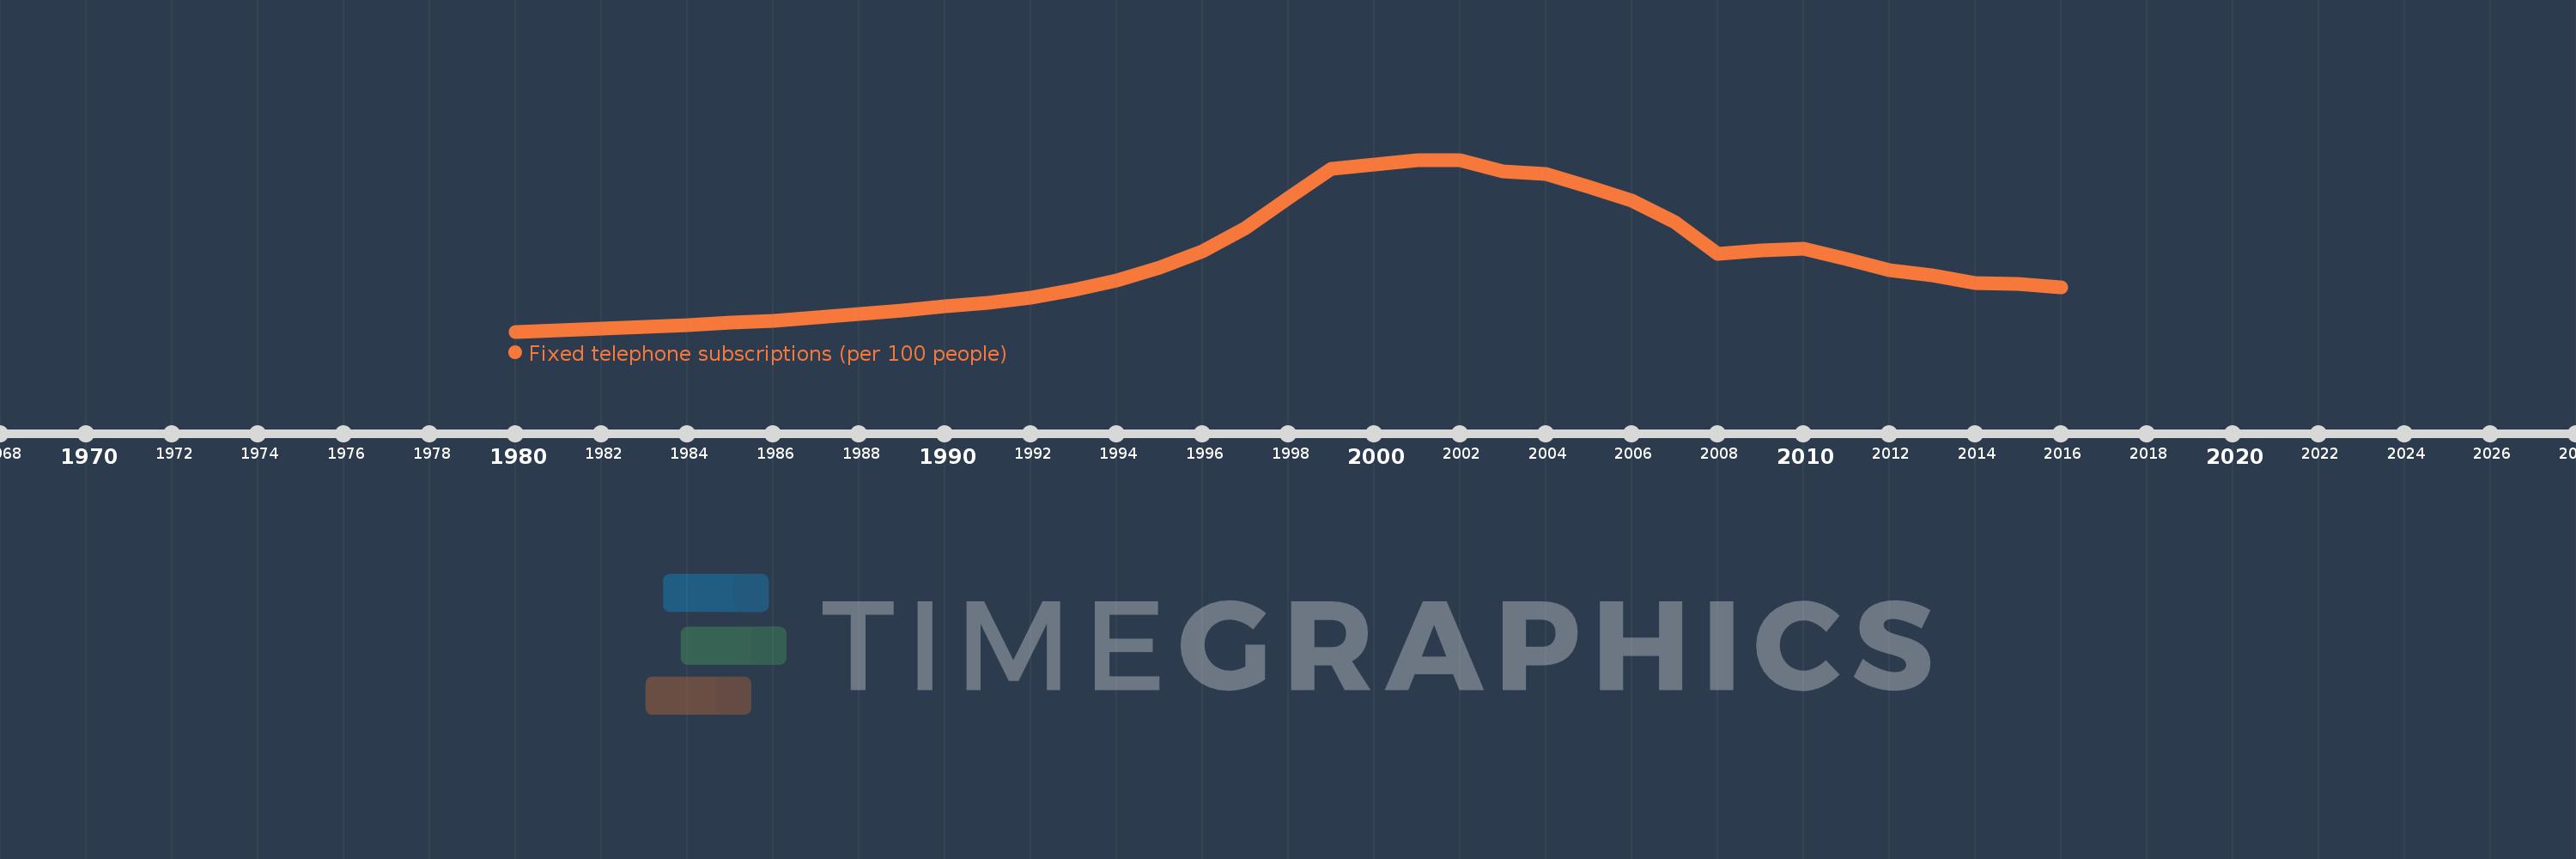
Fixed telephone subscriptions (per 100 people)
2016,2015,2014,2013,2012,2011,2010,2009,2008,2007,2006,2005,2004,2003,2002,2001,2000,1999,1998,1997,1996,1995,1994,1993,1992,1991,1990,1989,1988,1987,1986,1985,1984,1983,1982,1981,1980
This statistics in other country:
AfghanistanAlbaniaAlgeriaAmerican SamoaAndorraAngolaAntigua and BarbudaArab WorldArgentinaArmeniaArubaAustraliaAustriaAzerbaijanBahamas, TheBahrainBangladeshBarbadosBelarusBelgiumBelizeBeninBermudaBhutanBoliviaBosnia and HerzegovinaBotswanaBrazilBritish Virgin IslandsBrunei DarussalamBulgariaBurkina FasoBurundiCabo VerdeCambodiaCameroonCanadaCaribbean small statesCayman IslandsCentral African RepublicCentral Europe and the BalticsChadChileChinaColombiaComorosCongo, Dem. Rep.Congo, Rep.Costa RicaCote d'IvoireCroatiaCubaCuracaoCyprusCzech RepublicDenmarkDjiboutiDominicaDominican RepublicEarly-demographic dividendEast Asia & PacificEast Asia & Pacific (excluding high income)East Asia & Pacific (IDA & IBRD countries)EcuadorEgypt, Arab Rep.El SalvadorEquatorial GuineaEritreaEstoniaEthiopiaEuro areaEurope & Central AsiaEurope & Central Asia (excluding high income)Europe & Central Asia (IDA & IBRD countries)European UnionFaroe IslandsFijiFinlandFragile and conflict affected situationsFranceFrench PolynesiaGabonGambia, TheGeorgiaGermanyGhanaGibraltarGreeceGreenlandGrenadaGuamGuatemalaGuineaGuinea-BissauGuyanaHaitiHeavily indebted poor countries (HIPC)High incomeHondurasHong Kong SAR, ChinaHungaryIBRD onlyIcelandIDA & IBRD totalIDA blendIDA onlyIDA totalIndiaIndonesiaIran, Islamic Rep.IraqIrelandIsraelItalyJamaicaJapanJordanKazakhstanKenyaKiribatiKorea, Dem. People’s Rep.Korea, Rep.KosovoKuwaitKyrgyz RepublicLao PDRLate-demographic dividendLatin America & Caribbean Latin America & Caribbean (excluding high income)Latin America & the Caribbean (IDA & IBRD countries)LatviaLeast developed countries: UN classificationLebanonLesothoLiberiaLibyaLiechtensteinLithuaniaLow & middle incomeLow incomeLower middle incomeLuxembourgMacao SAR, ChinaMacedonia, FYRMadagascarMalawiMalaysiaMaldivesMaliMaltaMarshall IslandsMauritaniaMauritiusMexicoMicronesia, Fed. Sts.Middle East & North AfricaMiddle East & North Africa (excluding high income)Middle East & North Africa (IDA & IBRD countries)Middle incomeMoldovaMonacoMongoliaMontenegroMoroccoMozambiqueMyanmarNamibiaNauruNepalNetherlandsNew CaledoniaNew ZealandNicaraguaNigerNigeriaNorth AmericaNorthern Mariana IslandsNorwayOECD membersOmanOther small statesPacific island small statesPakistanPalauPanamaPapua New GuineaParaguayPeruPhilippinesPolandPortugalPost-demographic dividendPre-demographic dividendPuerto RicoQatarRomaniaRussian FederationRwandaSamoaSan MarinoSao Tome and PrincipeSaudi ArabiaSenegalSerbiaSeychellesSierra LeoneSingaporeSlovak RepublicSloveniaSmall statesSolomon IslandsSomaliaSouth AfricaSouth AsiaSouth Asia (IDA & IBRD)South SudanSpainSri LankaSt. Kitts and NevisSt. LuciaSt. Vincent and the GrenadinesSub-Saharan Africa Sub-Saharan Africa (excluding high income)Sub-Saharan Africa (IDA & IBRD countries)SudanSurinameSwazilandSwedenSwitzerlandSyrian Arab RepublicTajikistanTanzaniaThailandTimor-LesteTogoTongaTrinidad and TobagoTunisiaTurkeyTurkmenistanTurks and Caicos IslandsTuvaluUgandaUkraineUnited Arab EmiratesUnited KingdomUnited StatesUpper middle incomeUruguayUzbekistanVanuatuVenezuela, RBVietnamVirgin Islands (U.S.)West Bank and GazaWorldYemen, Rep.ZambiaZimbabwe Timeline:
This timeline shows a graph from 1980 to 2016 of Czech Republic. No data until 1979. Number of actual observations by date: 37.
Source name:
World Development Indicators
Source organization:
International Telecommunication Union, World Telecommunication/ICT Development Report and database.
Categories, topics:
Infrastructure
Last updated:
apr 23, 2017
Indicators value changes by year
Minimum:
11.221
jan 1, 1980
Maximum:
37.771
jan 1, 2001
At the date of observation
Value
Absolute change
Change from previous value
jan 1, 1980
11.221
+11.221
0.0%
jan 1, 1981
11.429
+0.208
1.85%
jan 1, 1982
11.654
+0.225
1.97%
jan 1, 1983
11.899
+0.245
2.11%
jan 1, 1984
12.273
+0.374
3.14%
jan 1, 1985
12.592
+0.319
2.6%
jan 1, 1986
12.898
+0.306
2.43%
jan 1, 1987
13.366
+0.469
3.63%
jan 1, 1988
13.918
+0.552
4.13%
jan 1, 1989
14.486
+0.567
4.08%
jan 1, 1990
15.086
+0.6
4.14%
jan 1, 1991
15.724
+0.638
4.23%
jan 1, 1992
16.529
+0.805
5.12%
jan 1, 1993
17.595
+1.066
6.45%
jan 1, 1994
19.071
+1.476
8.39%
jan 1, 1995
21.055
+1.985
10.41%
jan 1, 1996
23.64
+2.584
12.27%
jan 1, 1997
27.278
+3.638
15.39%
jan 1, 1998
31.808
+4.53
16.61%
jan 1, 1999
36.356
+4.549
14.3%
jan 1, 2000
37.06
+0.704
1.94%
jan 1, 2001
37.771
+0.71
1.92%
jan 1, 2002
37.735
-0.036
-0.09%
jan 1, 2003
35.984
-1.751
-4.64%
jan 1, 2004
35.539
-0.446
-1.24%
jan 1, 2005
33.579
-1.96
-5.51%
jan 1, 2006
31.448
-2.131
-6.35%
jan 1, 2007
28.103
-3.345
-10.64%
jan 1, 2008
23.243
-4.861
-17.3%
jan 1, 2009
23.799
+0.556
2.39%
jan 1, 2010
24.096
+0.297
1.25%
jan 1, 2011
22.432
-1.664
-6.91%
jan 1, 2012
20.77
-1.662
-7.41%
jan 1, 2013
19.863
-0.907
-4.37%
jan 1, 2014
18.697
-1.166
-5.87%
jan 1, 2015
18.639
-0.058
-0.31%
jan 1, 2016
18.092
-0.547
-2.93%
Ranking of countries by current statistics by years


Comments: