29
/
en
AIzaSyAYiBZKx7MnpbEhh9jyipgxe19OcubqV5w
April 1, 2024
208698
New Caledonia
NCL
true
2
1
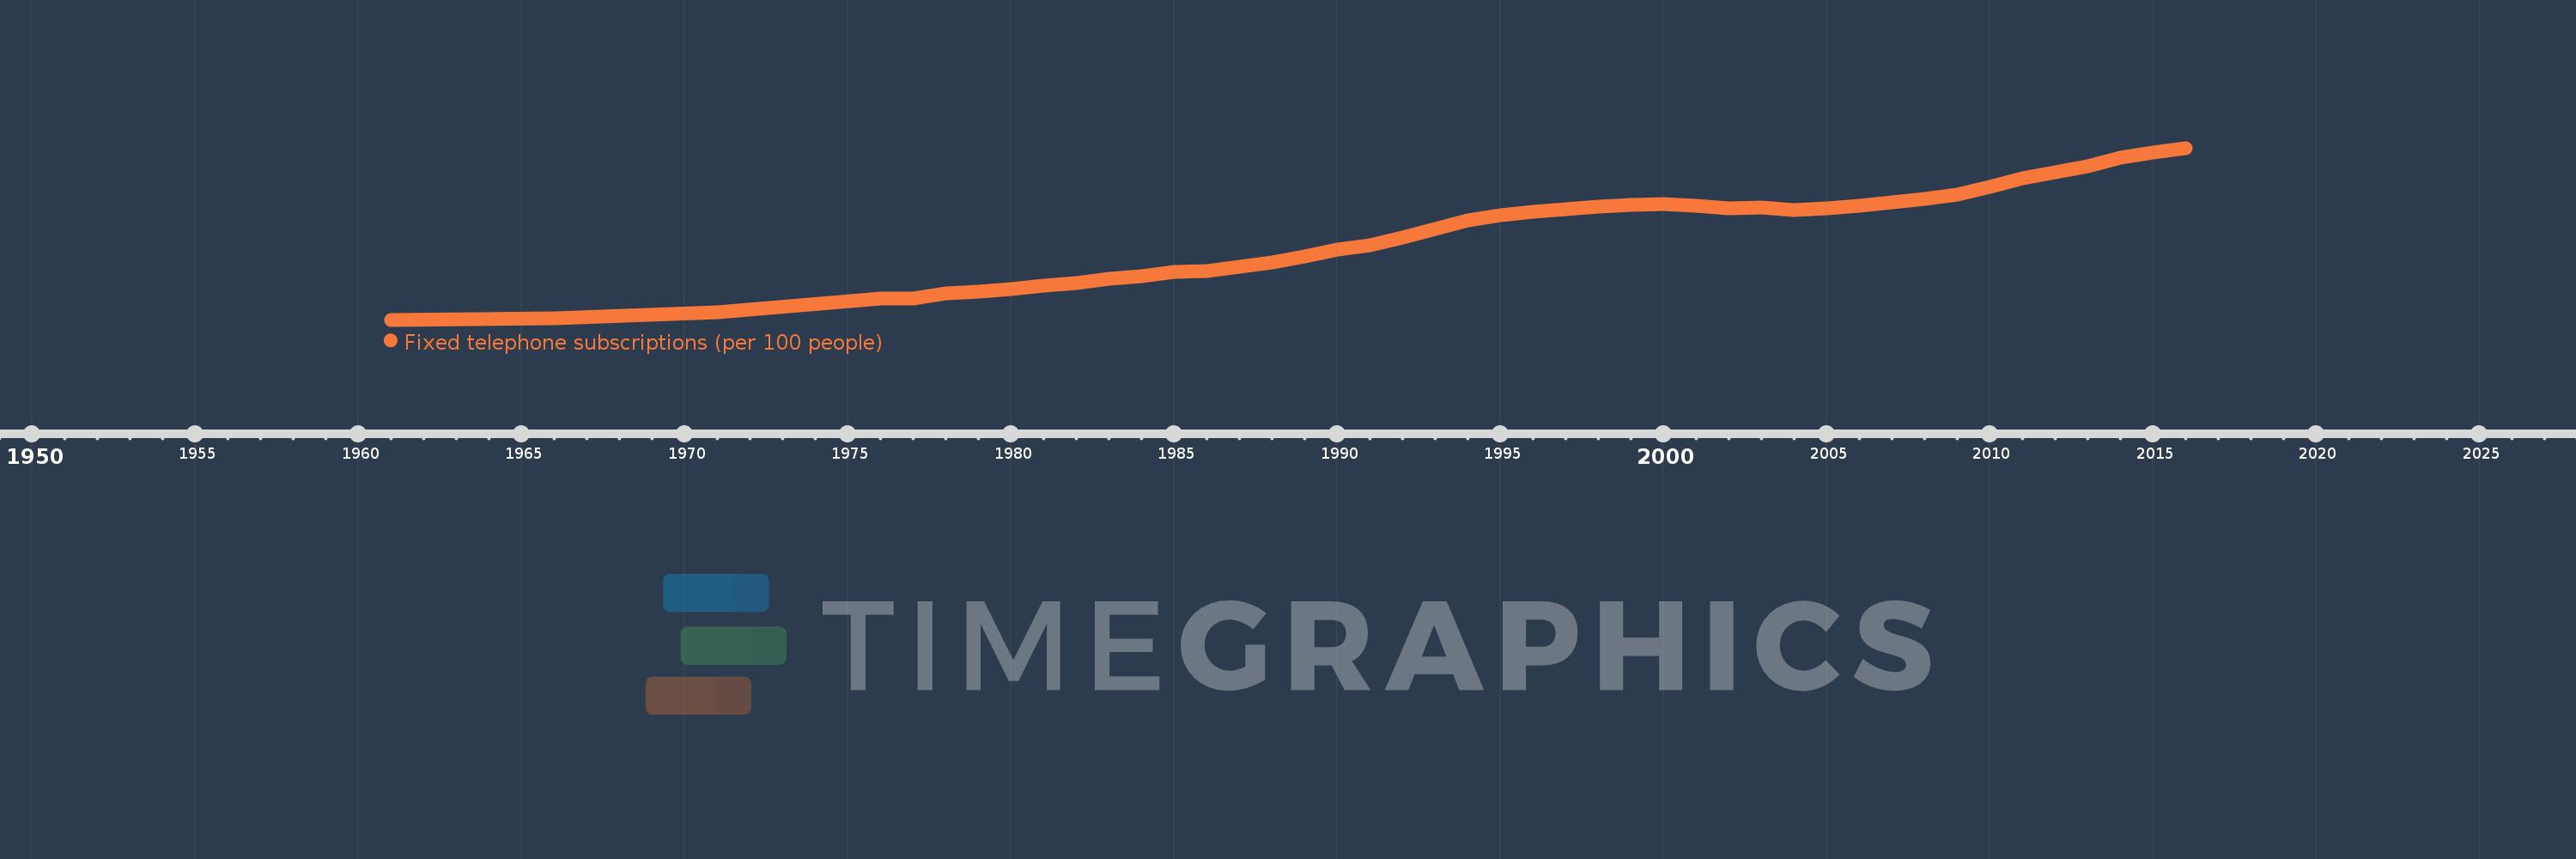
Fixed telephone subscriptions (per 100 people)
2016,2015,2014,2013,2012,2011,2010,2009,2008,2007,2006,2005,2004,2003,2002,2001,2000,1999,1998,1997,1996,1995,1994,1993,1992,1991,1990,1989,1988,1987,1986,1985,1984,1983,1982,1981,1980,1979,1978,1977,1976,1971,1966,1961
This statistics in other country:
AfghanistanAlbaniaAlgeriaAmerican SamoaAndorraAngolaAntigua and BarbudaArab WorldArgentinaArmeniaArubaAustraliaAustriaAzerbaijanBahamas, TheBahrainBangladeshBarbadosBelarusBelgiumBelizeBeninBermudaBhutanBoliviaBosnia and HerzegovinaBotswanaBrazilBritish Virgin IslandsBrunei DarussalamBulgariaBurkina FasoBurundiCabo VerdeCambodiaCameroonCanadaCaribbean small statesCayman IslandsCentral African RepublicCentral Europe and the BalticsChadChileChinaColombiaComorosCongo, Dem. Rep.Congo, Rep.Costa RicaCote d'IvoireCroatiaCubaCuracaoCyprusCzech RepublicDenmarkDjiboutiDominicaDominican RepublicEarly-demographic dividendEast Asia & PacificEast Asia & Pacific (excluding high income)East Asia & Pacific (IDA & IBRD countries)EcuadorEgypt, Arab Rep.El SalvadorEquatorial GuineaEritreaEstoniaEthiopiaEuro areaEurope & Central AsiaEurope & Central Asia (excluding high income)Europe & Central Asia (IDA & IBRD countries)European UnionFaroe IslandsFijiFinlandFragile and conflict affected situationsFranceFrench PolynesiaGabonGambia, TheGeorgiaGermanyGhanaGibraltarGreeceGreenlandGrenadaGuamGuatemalaGuineaGuinea-BissauGuyanaHaitiHeavily indebted poor countries (HIPC)High incomeHondurasHong Kong SAR, ChinaHungaryIBRD onlyIcelandIDA & IBRD totalIDA blendIDA onlyIDA totalIndiaIndonesiaIran, Islamic Rep.IraqIrelandIsraelItalyJamaicaJapanJordanKazakhstanKenyaKiribatiKorea, Dem. People’s Rep.Korea, Rep.KosovoKuwaitKyrgyz RepublicLao PDRLate-demographic dividendLatin America & Caribbean Latin America & Caribbean (excluding high income)Latin America & the Caribbean (IDA & IBRD countries)LatviaLeast developed countries: UN classificationLebanonLesothoLiberiaLibyaLiechtensteinLithuaniaLow & middle incomeLow incomeLower middle incomeLuxembourgMacao SAR, ChinaMacedonia, FYRMadagascarMalawiMalaysiaMaldivesMaliMaltaMarshall IslandsMauritaniaMauritiusMexicoMicronesia, Fed. Sts.Middle East & North AfricaMiddle East & North Africa (excluding high income)Middle East & North Africa (IDA & IBRD countries)Middle incomeMoldovaMonacoMongoliaMontenegroMoroccoMozambiqueMyanmarNamibiaNauruNepalNetherlandsNew CaledoniaNew ZealandNicaraguaNigerNigeriaNorth AmericaNorthern Mariana IslandsNorwayOECD membersOmanOther small statesPacific island small statesPakistanPalauPanamaPapua New GuineaParaguayPeruPhilippinesPolandPortugalPost-demographic dividendPre-demographic dividendPuerto RicoQatarRomaniaRussian FederationRwandaSamoaSan MarinoSao Tome and PrincipeSaudi ArabiaSenegalSerbiaSeychellesSierra LeoneSingaporeSlovak RepublicSloveniaSmall statesSolomon IslandsSomaliaSouth AfricaSouth AsiaSouth Asia (IDA & IBRD)South SudanSpainSri LankaSt. Kitts and NevisSt. LuciaSt. Vincent and the GrenadinesSub-Saharan Africa Sub-Saharan Africa (excluding high income)Sub-Saharan Africa (IDA & IBRD countries)SudanSurinameSwazilandSwedenSwitzerlandSyrian Arab RepublicTajikistanTanzaniaThailandTimor-LesteTogoTongaTrinidad and TobagoTunisiaTurkeyTurkmenistanTurks and Caicos IslandsTuvaluUgandaUkraineUnited Arab EmiratesUnited KingdomUnited StatesUpper middle incomeUruguayUzbekistanVanuatuVenezuela, RBVietnamVirgin Islands (U.S.)West Bank and GazaWorldYemen, Rep.ZambiaZimbabwe Timeline:
This timeline shows a graph from 1961 to 2016 of New Caledonia. No data until 1960. Number of actual observations by date: 44.
Source name:
World Development Indicators
Source organization:
International Telecommunication Union, World Telecommunication/ICT Development Report and database.
Categories, topics:
Infrastructure
Last updated:
apr 23, 2017
Indicators value changes by year
Maximum:
34.961
jan 1, 2016
At the date of observation
Value
Absolute change
Change from previous value
jan 1, 1961
3.067
+3.067
0.0%
jan 1, 1966
3.399
+0.332
10.83%
jan 1, 1971
4.475
+1.076
31.65%
jan 1, 1976
6.941
+2.466
55.11%
jan 1, 1977
7.058
+0.117
1.69%
jan 1, 1978
7.943
+0.885
12.53%
jan 1, 1979
8.308
+0.365
4.59%
jan 1, 1980
8.714
+0.406
4.89%
jan 1, 1981
9.333
+0.619
7.1%
jan 1, 1982
9.853
+0.52
5.57%
jan 1, 1983
10.594
+0.741
7.53%
jan 1, 1984
11.222
+0.628
5.93%
jan 1, 1985
11.893
+0.671
5.98%
jan 1, 1986
12.142
+0.249
2.09%
jan 1, 1987
12.979
+0.837
6.89%
jan 1, 1988
13.768
+0.789
6.08%
jan 1, 1989
14.786
+1.019
7.4%
jan 1, 1990
16.135
+1.348
9.12%
jan 1, 1991
16.84
+0.706
4.37%
jan 1, 1992
18.27
+1.43
8.49%
jan 1, 1993
19.915
+1.645
9.01%
jan 1, 1994
21.459
+1.544
7.75%
jan 1, 1995
22.501
+1.042
4.86%
jan 1, 1996
23.108
+0.607
2.7%
jan 1, 1997
23.553
+0.445
1.93%
jan 1, 1998
24.013
+0.459
1.95%
jan 1, 1999
24.398
+0.385
1.6%
jan 1, 2000
24.589
+0.191
0.78%
jan 1, 2001
24.287
-0.302
-1.23%
jan 1, 2002
23.705
-0.582
-2.4%
jan 1, 2003
23.884
+0.179
0.76%
jan 1, 2004
23.451
-0.433
-1.81%
jan 1, 2005
23.682
+0.231
0.99%
jan 1, 2006
24.183
+0.501
2.11%
jan 1, 2007
24.88
+0.697
2.88%
jan 1, 2008
25.524
+0.644
2.59%
jan 1, 2009
26.315
+0.791
3.1%
jan 1, 2010
27.756
+1.441
5.47%
jan 1, 2011
29.304
+1.549
5.58%
jan 1, 2012
30.505
+1.2
4.1%
jan 1, 2013
31.601
+1.097
3.6%
jan 1, 2014
33.139
+1.538
4.87%
jan 1, 2015
34.062
+0.923
2.78%
jan 1, 2016
34.961
+0.9
2.64%
Ranking of countries by current statistics by years


Comments: