29
/
en
AIzaSyAYiBZKx7MnpbEhh9jyipgxe19OcubqV5w
April 1, 2024
24086
Arab World
ARB
false
2
1
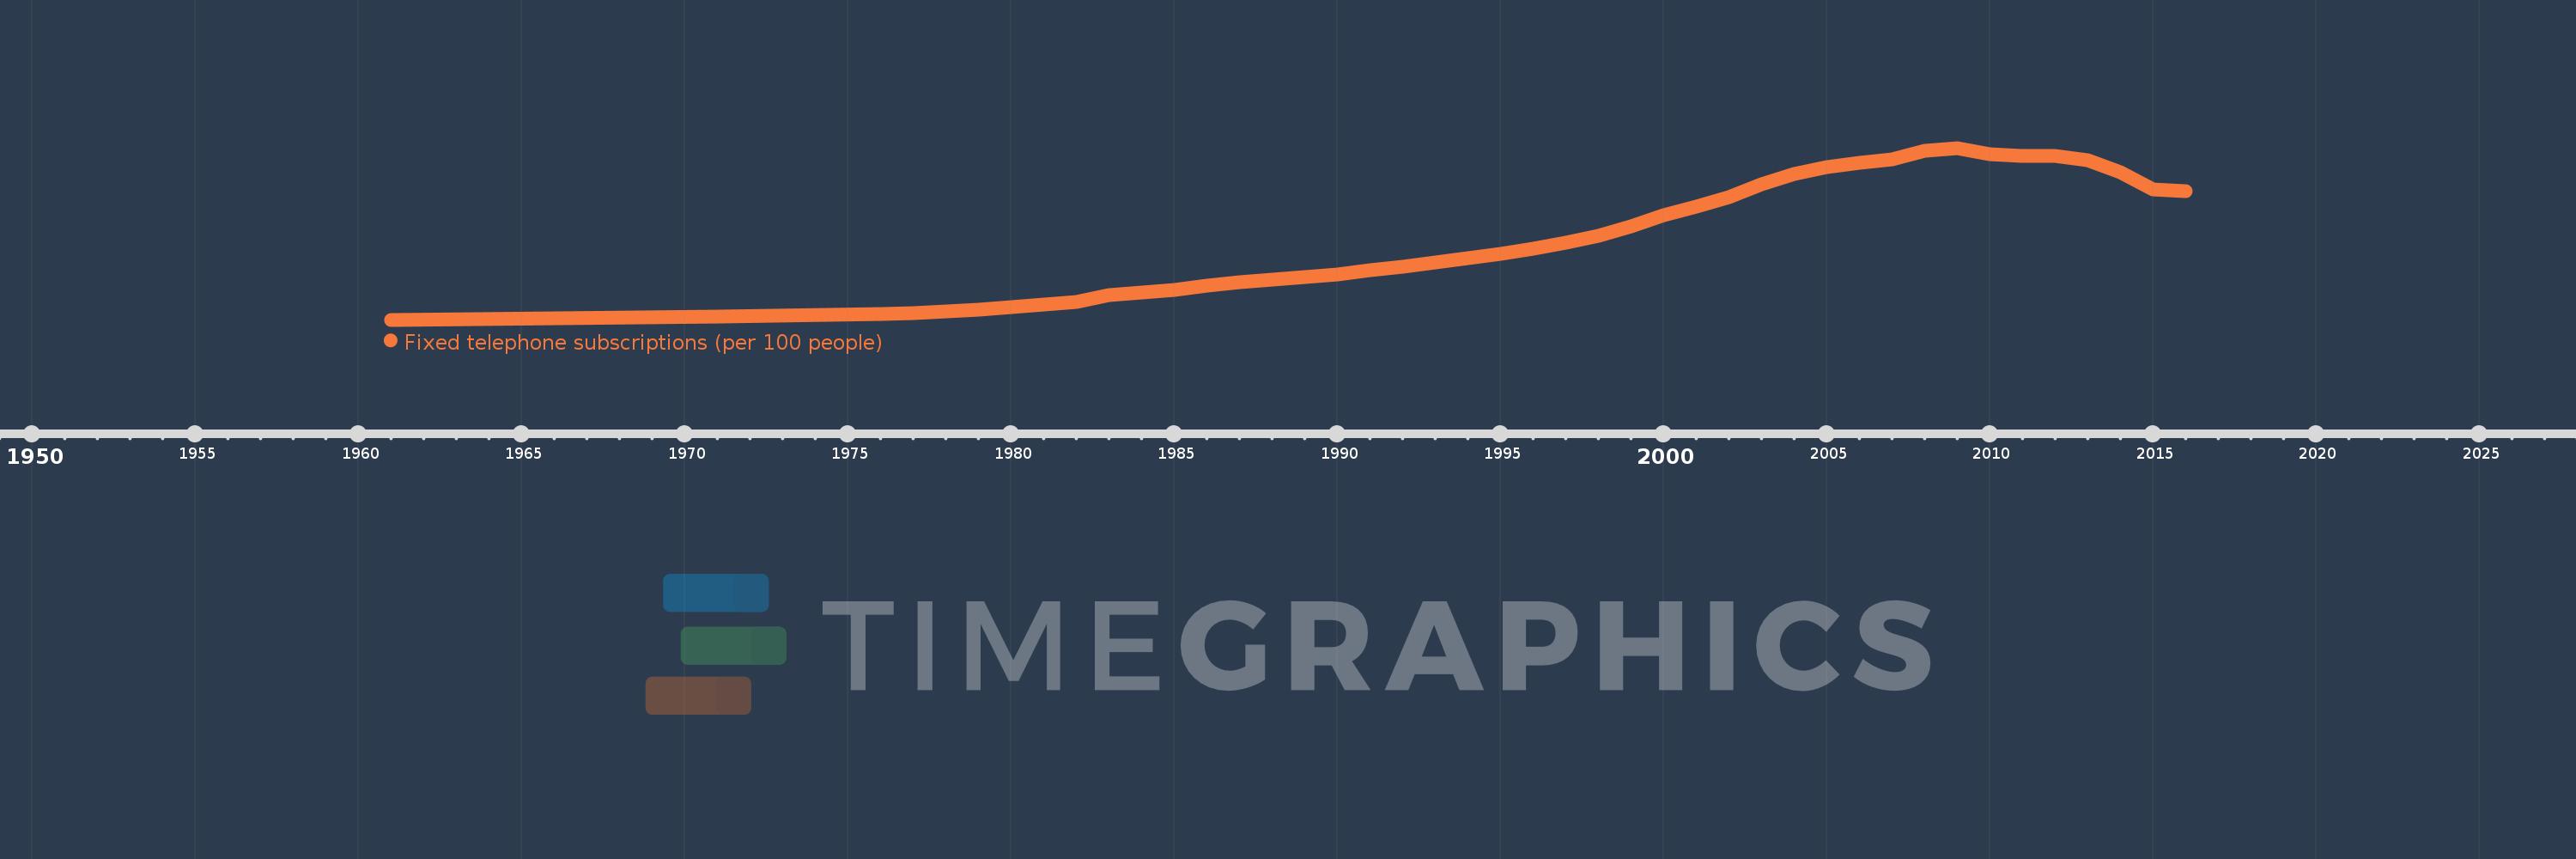
Fixed telephone subscriptions (per 100 people)
2016,2015,2014,2013,2012,2011,2010,2009,2008,2007,2006,2005,2004,2003,2002,2001,2000,1999,1998,1997,1996,1995,1994,1993,1992,1991,1990,1989,1988,1987,1986,1985,1984,1983,1982,1980,1979,1978,1977,1976,1971,1961
This statistics in other country:
AfghanistanAlbaniaAlgeriaAmerican SamoaAndorraAngolaAntigua and BarbudaArab WorldArgentinaArmeniaArubaAustraliaAustriaAzerbaijanBahamas, TheBahrainBangladeshBarbadosBelarusBelgiumBelizeBeninBermudaBhutanBoliviaBosnia and HerzegovinaBotswanaBrazilBritish Virgin IslandsBrunei DarussalamBulgariaBurkina FasoBurundiCabo VerdeCambodiaCameroonCanadaCaribbean small statesCayman IslandsCentral African RepublicCentral Europe and the BalticsChadChileChinaColombiaComorosCongo, Dem. Rep.Congo, Rep.Costa RicaCote d'IvoireCroatiaCubaCuracaoCyprusCzech RepublicDenmarkDjiboutiDominicaDominican RepublicEarly-demographic dividendEast Asia & PacificEast Asia & Pacific (excluding high income)East Asia & Pacific (IDA & IBRD countries)EcuadorEgypt, Arab Rep.El SalvadorEquatorial GuineaEritreaEstoniaEthiopiaEuro areaEurope & Central AsiaEurope & Central Asia (excluding high income)Europe & Central Asia (IDA & IBRD countries)European UnionFaroe IslandsFijiFinlandFragile and conflict affected situationsFranceFrench PolynesiaGabonGambia, TheGeorgiaGermanyGhanaGibraltarGreeceGreenlandGrenadaGuamGuatemalaGuineaGuinea-BissauGuyanaHaitiHeavily indebted poor countries (HIPC)High incomeHondurasHong Kong SAR, ChinaHungaryIBRD onlyIcelandIDA & IBRD totalIDA blendIDA onlyIDA totalIndiaIndonesiaIran, Islamic Rep.IraqIrelandIsraelItalyJamaicaJapanJordanKazakhstanKenyaKiribatiKorea, Dem. People’s Rep.Korea, Rep.KosovoKuwaitKyrgyz RepublicLao PDRLate-demographic dividendLatin America & Caribbean Latin America & Caribbean (excluding high income)Latin America & the Caribbean (IDA & IBRD countries)LatviaLeast developed countries: UN classificationLebanonLesothoLiberiaLibyaLiechtensteinLithuaniaLow & middle incomeLow incomeLower middle incomeLuxembourgMacao SAR, ChinaMacedonia, FYRMadagascarMalawiMalaysiaMaldivesMaliMaltaMarshall IslandsMauritaniaMauritiusMexicoMicronesia, Fed. Sts.Middle East & North AfricaMiddle East & North Africa (excluding high income)Middle East & North Africa (IDA & IBRD countries)Middle incomeMoldovaMonacoMongoliaMontenegroMoroccoMozambiqueMyanmarNamibiaNauruNepalNetherlandsNew CaledoniaNew ZealandNicaraguaNigerNigeriaNorth AmericaNorthern Mariana IslandsNorwayOECD membersOmanOther small statesPacific island small statesPakistanPalauPanamaPapua New GuineaParaguayPeruPhilippinesPolandPortugalPost-demographic dividendPre-demographic dividendPuerto RicoQatarRomaniaRussian FederationRwandaSamoaSan MarinoSao Tome and PrincipeSaudi ArabiaSenegalSerbiaSeychellesSierra LeoneSingaporeSlovak RepublicSloveniaSmall statesSolomon IslandsSomaliaSouth AfricaSouth AsiaSouth Asia (IDA & IBRD)South SudanSpainSri LankaSt. Kitts and NevisSt. LuciaSt. Vincent and the GrenadinesSub-Saharan Africa Sub-Saharan Africa (excluding high income)Sub-Saharan Africa (IDA & IBRD countries)SudanSurinameSwazilandSwedenSwitzerlandSyrian Arab RepublicTajikistanTanzaniaThailandTimor-LesteTogoTongaTrinidad and TobagoTunisiaTurkeyTurkmenistanTurks and Caicos IslandsTuvaluUgandaUkraineUnited Arab EmiratesUnited KingdomUnited StatesUpper middle incomeUruguayUzbekistanVanuatuVenezuela, RBVietnamVirgin Islands (U.S.)West Bank and GazaWorldYemen, Rep.ZambiaZimbabwe Timeline:
This timeline shows a graph from 1961 to 2016 of Arab World. No data until 1960. Number of actual observations by date: 42.
Source name:
World Development Indicators
Source organization:
International Telecommunication Union, World Telecommunication/ICT Development Report and database.
Categories, topics:
Infrastructure
Last updated:
apr 23, 2017
Indicators value changes by year
Maximum:
10.277
jan 1, 2009
At the date of observation
Value
Absolute change
Change from previous value
jan 1, 1961
0.617
+0.617
0.0%
jan 1, 1971
0.787
+0.17
27.54%
jan 1, 1976
0.943
+0.156
19.88%
jan 1, 1977
0.986
+0.043
4.53%
jan 1, 1978
1.071
+0.086
8.69%
jan 1, 1979
1.175
+0.103
9.65%
jan 1, 1980
1.329
+0.154
13.14%
jan 1, 1982
1.636
+0.307
23.08%
jan 1, 1983
1.994
+0.358
21.88%
jan 1, 1984
2.156
+0.162
8.14%
jan 1, 1985
2.301
+0.145
6.74%
jan 1, 1986
2.548
+0.247
10.73%
jan 1, 1987
2.731
+0.182
7.15%
jan 1, 1988
2.867
+0.136
5.0%
jan 1, 1989
3.0
+0.133
4.64%
jan 1, 1990
3.17
+0.17
5.68%
jan 1, 1991
3.386
+0.215
6.79%
jan 1, 1992
3.612
+0.226
6.67%
jan 1, 1993
3.858
+0.247
6.83%
jan 1, 1994
4.077
+0.219
5.67%
jan 1, 1995
4.32
+0.244
5.97%
jan 1, 1996
4.606
+0.285
6.6%
jan 1, 1997
4.944
+0.338
7.34%
jan 1, 1998
5.327
+0.383
7.75%
jan 1, 1999
5.852
+0.525
9.86%
jan 1, 2000
6.486
+0.634
10.83%
jan 1, 2001
6.982
+0.496
7.65%
jan 1, 2002
7.509
+0.527
7.55%
jan 1, 2003
8.242
+0.733
9.77%
jan 1, 2004
8.794
+0.551
6.69%
jan 1, 2005
9.202
+0.408
4.64%
jan 1, 2006
9.448
+0.246
2.68%
jan 1, 2007
9.654
+0.205
2.17%
jan 1, 2008
10.104
+0.45
4.67%
jan 1, 2009
10.277
+0.173
1.71%
jan 1, 2010
9.944
-0.333
-3.24%
jan 1, 2011
9.831
-0.113
-1.13%
jan 1, 2012
9.819
-0.012
-0.12%
jan 1, 2013
9.59
-0.229
-2.33%
jan 1, 2014
8.899
-0.691
-7.21%
jan 1, 2015
7.923
-0.976
-10.97%
jan 1, 2016
7.833
-0.09
-1.13%
Ranking of countries by current statistics by years


Comments: