29
/
en
AIzaSyAYiBZKx7MnpbEhh9jyipgxe19OcubqV5w
April 1, 2024
160463
Israel
ISR
true
2
1
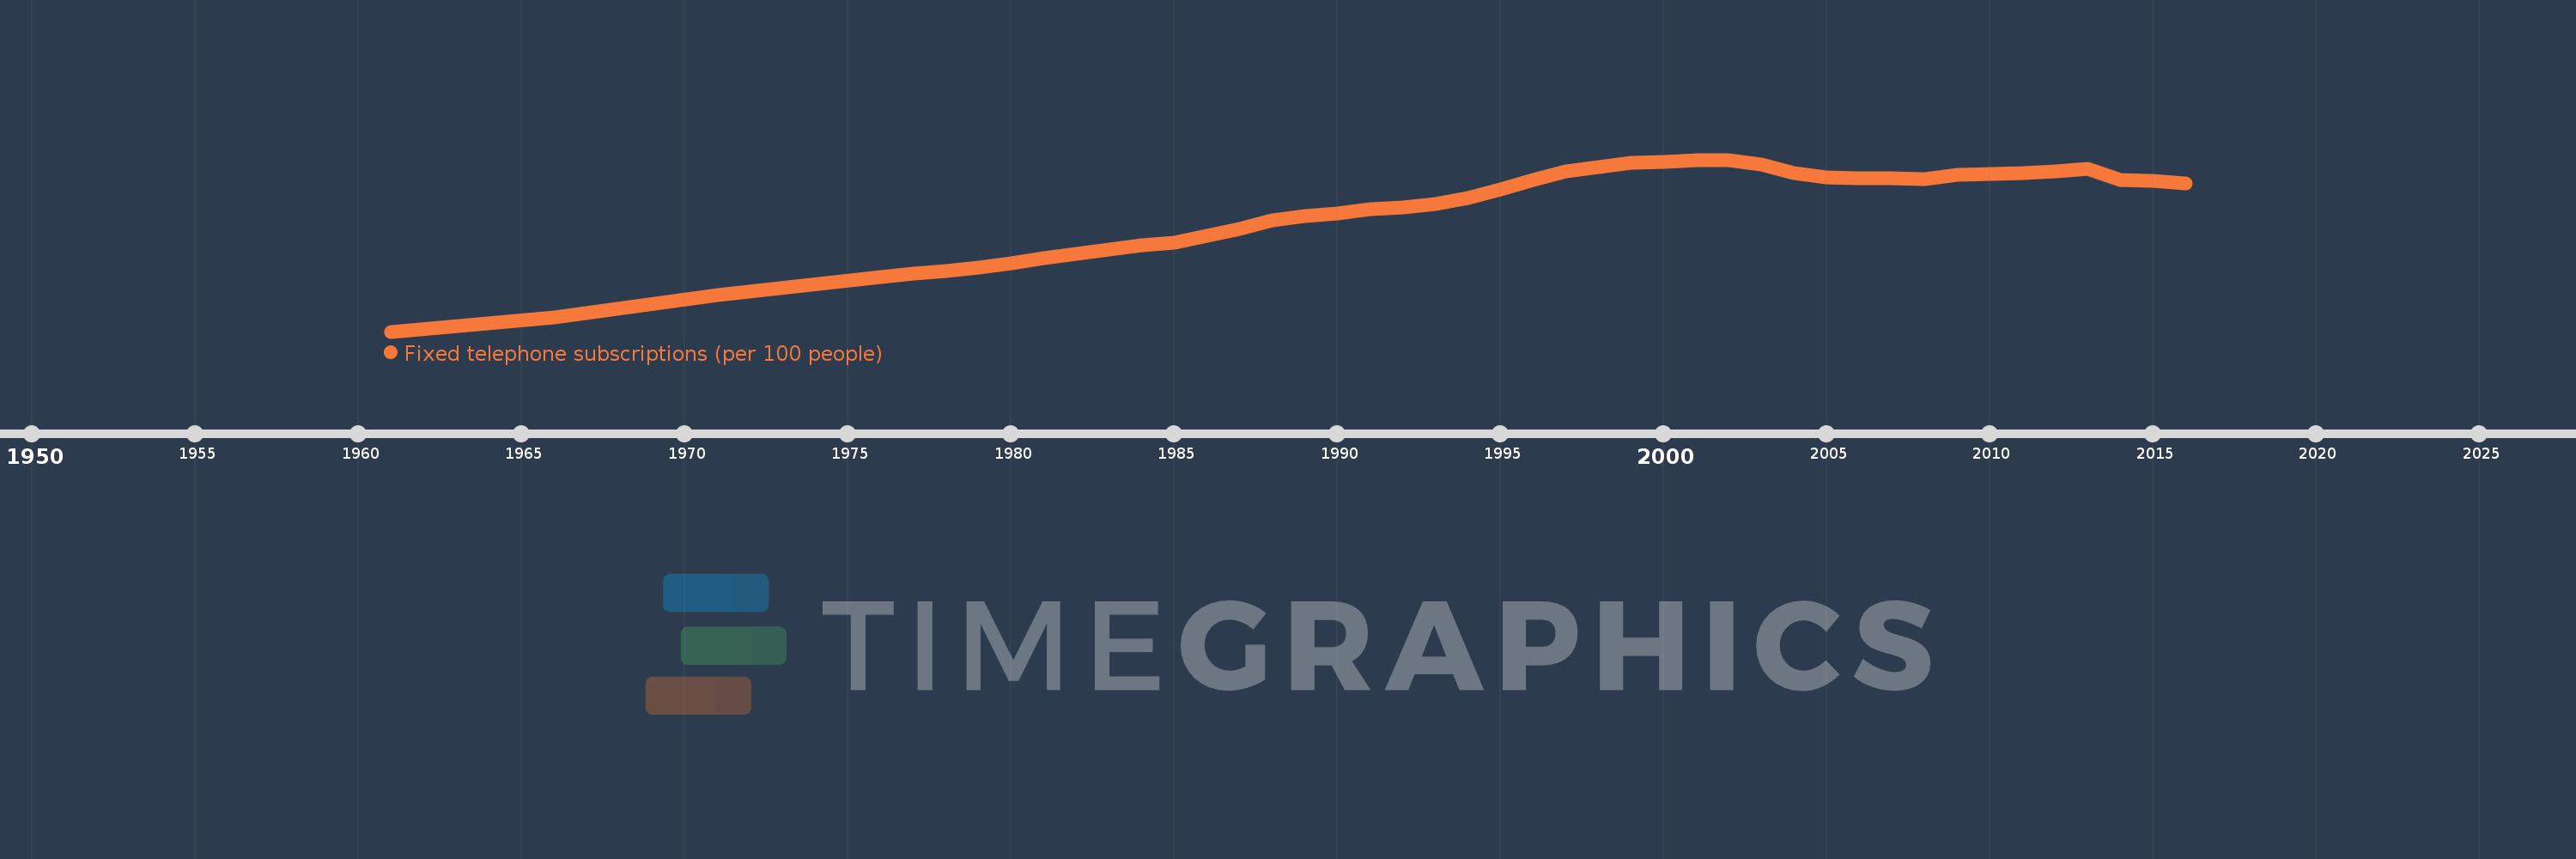
Fixed telephone subscriptions (per 100 people)
2016,2015,2014,2013,2012,2011,2010,2009,2008,2007,2006,2005,2004,2003,2002,2001,2000,1999,1998,1997,1996,1995,1994,1993,1992,1991,1990,1989,1988,1987,1986,1985,1984,1983,1982,1981,1980,1979,1978,1977,1976,1971,1966,1961
This statistics in other country:
AfghanistanAlbaniaAlgeriaAmerican SamoaAndorraAngolaAntigua and BarbudaArab WorldArgentinaArmeniaArubaAustraliaAustriaAzerbaijanBahamas, TheBahrainBangladeshBarbadosBelarusBelgiumBelizeBeninBermudaBhutanBoliviaBosnia and HerzegovinaBotswanaBrazilBritish Virgin IslandsBrunei DarussalamBulgariaBurkina FasoBurundiCabo VerdeCambodiaCameroonCanadaCaribbean small statesCayman IslandsCentral African RepublicCentral Europe and the BalticsChadChileChinaColombiaComorosCongo, Dem. Rep.Congo, Rep.Costa RicaCote d'IvoireCroatiaCubaCuracaoCyprusCzech RepublicDenmarkDjiboutiDominicaDominican RepublicEarly-demographic dividendEast Asia & PacificEast Asia & Pacific (excluding high income)East Asia & Pacific (IDA & IBRD countries)EcuadorEgypt, Arab Rep.El SalvadorEquatorial GuineaEritreaEstoniaEthiopiaEuro areaEurope & Central AsiaEurope & Central Asia (excluding high income)Europe & Central Asia (IDA & IBRD countries)European UnionFaroe IslandsFijiFinlandFragile and conflict affected situationsFranceFrench PolynesiaGabonGambia, TheGeorgiaGermanyGhanaGibraltarGreeceGreenlandGrenadaGuamGuatemalaGuineaGuinea-BissauGuyanaHaitiHeavily indebted poor countries (HIPC)High incomeHondurasHong Kong SAR, ChinaHungaryIBRD onlyIcelandIDA & IBRD totalIDA blendIDA onlyIDA totalIndiaIndonesiaIran, Islamic Rep.IraqIrelandIsraelItalyJamaicaJapanJordanKazakhstanKenyaKiribatiKorea, Dem. People’s Rep.Korea, Rep.KosovoKuwaitKyrgyz RepublicLao PDRLate-demographic dividendLatin America & Caribbean Latin America & Caribbean (excluding high income)Latin America & the Caribbean (IDA & IBRD countries)LatviaLeast developed countries: UN classificationLebanonLesothoLiberiaLibyaLiechtensteinLithuaniaLow & middle incomeLow incomeLower middle incomeLuxembourgMacao SAR, ChinaMacedonia, FYRMadagascarMalawiMalaysiaMaldivesMaliMaltaMarshall IslandsMauritaniaMauritiusMexicoMicronesia, Fed. Sts.Middle East & North AfricaMiddle East & North Africa (excluding high income)Middle East & North Africa (IDA & IBRD countries)Middle incomeMoldovaMonacoMongoliaMontenegroMoroccoMozambiqueMyanmarNamibiaNauruNepalNetherlandsNew CaledoniaNew ZealandNicaraguaNigerNigeriaNorth AmericaNorthern Mariana IslandsNorwayOECD membersOmanOther small statesPacific island small statesPakistanPalauPanamaPapua New GuineaParaguayPeruPhilippinesPolandPortugalPost-demographic dividendPre-demographic dividendPuerto RicoQatarRomaniaRussian FederationRwandaSamoaSan MarinoSao Tome and PrincipeSaudi ArabiaSenegalSerbiaSeychellesSierra LeoneSingaporeSlovak RepublicSloveniaSmall statesSolomon IslandsSomaliaSouth AfricaSouth AsiaSouth Asia (IDA & IBRD)South SudanSpainSri LankaSt. Kitts and NevisSt. LuciaSt. Vincent and the GrenadinesSub-Saharan Africa Sub-Saharan Africa (excluding high income)Sub-Saharan Africa (IDA & IBRD countries)SudanSurinameSwazilandSwedenSwitzerlandSyrian Arab RepublicTajikistanTanzaniaThailandTimor-LesteTogoTongaTrinidad and TobagoTunisiaTurkeyTurkmenistanTurks and Caicos IslandsTuvaluUgandaUkraineUnited Arab EmiratesUnited KingdomUnited StatesUpper middle incomeUruguayUzbekistanVanuatuVenezuela, RBVietnamVirgin Islands (U.S.)West Bank and GazaWorldYemen, Rep.ZambiaZimbabwe Timeline:
This timeline shows a graph from 1961 to 2016 of Israel. No data until 1960. Number of actual observations by date: 44.
Source name:
World Development Indicators
Source organization:
International Telecommunication Union, World Telecommunication/ICT Development Report and database.
Categories, topics:
Infrastructure
Last updated:
apr 23, 2017
Indicators value changes by year
Maximum:
49.481
jan 1, 2002
At the date of observation
Value
Absolute change
Change from previous value
jan 1, 1961
3.101
+3.101
0.0%
jan 1, 1966
6.819
+3.717
119.87%
jan 1, 1971
12.949
+6.131
89.91%
jan 1, 1976
17.892
+4.943
38.17%
jan 1, 1977
18.724
+0.833
4.65%
jan 1, 1978
19.525
+0.8
4.28%
jan 1, 1979
20.331
+0.807
4.13%
jan 1, 1980
21.423
+1.092
5.37%
jan 1, 1981
22.953
+1.53
7.14%
jan 1, 1982
24.177
+1.224
5.33%
jan 1, 1983
25.168
+0.991
4.1%
jan 1, 1984
26.335
+1.167
4.64%
jan 1, 1985
27.04
+0.705
2.68%
jan 1, 1986
28.902
+1.862
6.88%
jan 1, 1987
30.925
+2.023
7.0%
jan 1, 1988
33.043
+2.118
6.85%
jan 1, 1989
34.303
+1.26
3.81%
jan 1, 1990
34.987
+0.683
1.99%
jan 1, 1991
36.15
+1.163
3.33%
jan 1, 1992
36.7
+0.55
1.52%
jan 1, 1993
37.529
+0.829
2.26%
jan 1, 1994
39.275
+1.746
4.65%
jan 1, 1995
41.401
+2.126
5.41%
jan 1, 1996
43.938
+2.537
6.13%
jan 1, 1997
46.282
+2.344
5.33%
jan 1, 1998
47.513
+1.231
2.66%
jan 1, 1999
48.697
+1.184
2.49%
jan 1, 2000
48.852
+0.155
0.32%
jan 1, 2001
49.454
+0.602
1.23%
jan 1, 2002
49.481
+0.028
0.06%
jan 1, 2003
48.181
-1.3
-2.63%
jan 1, 2004
45.883
-2.298
-4.77%
jan 1, 2005
44.772
-1.111
-2.42%
jan 1, 2006
44.465
-0.307
-0.69%
jan 1, 2007
44.456
-0.009
-0.02%
jan 1, 2008
44.366
-0.09
-0.2%
jan 1, 2009
45.365
+0.999
2.25%
jan 1, 2010
45.588
+0.223
0.49%
jan 1, 2011
45.928
+0.339
0.74%
jan 1, 2012
46.405
+0.477
1.04%
jan 1, 2013
47.018
+0.613
1.32%
jan 1, 2014
43.954
-3.064
-6.52%
jan 1, 2015
43.812
-0.142
-0.32%
jan 1, 2016
43.083
-0.728
-1.66%
Ranking of countries by current statistics by years


Comments: