29
/
en
AIzaSyAYiBZKx7MnpbEhh9jyipgxe19OcubqV5w
April 1, 2024
244581
Somalia
SOM
true
2
1
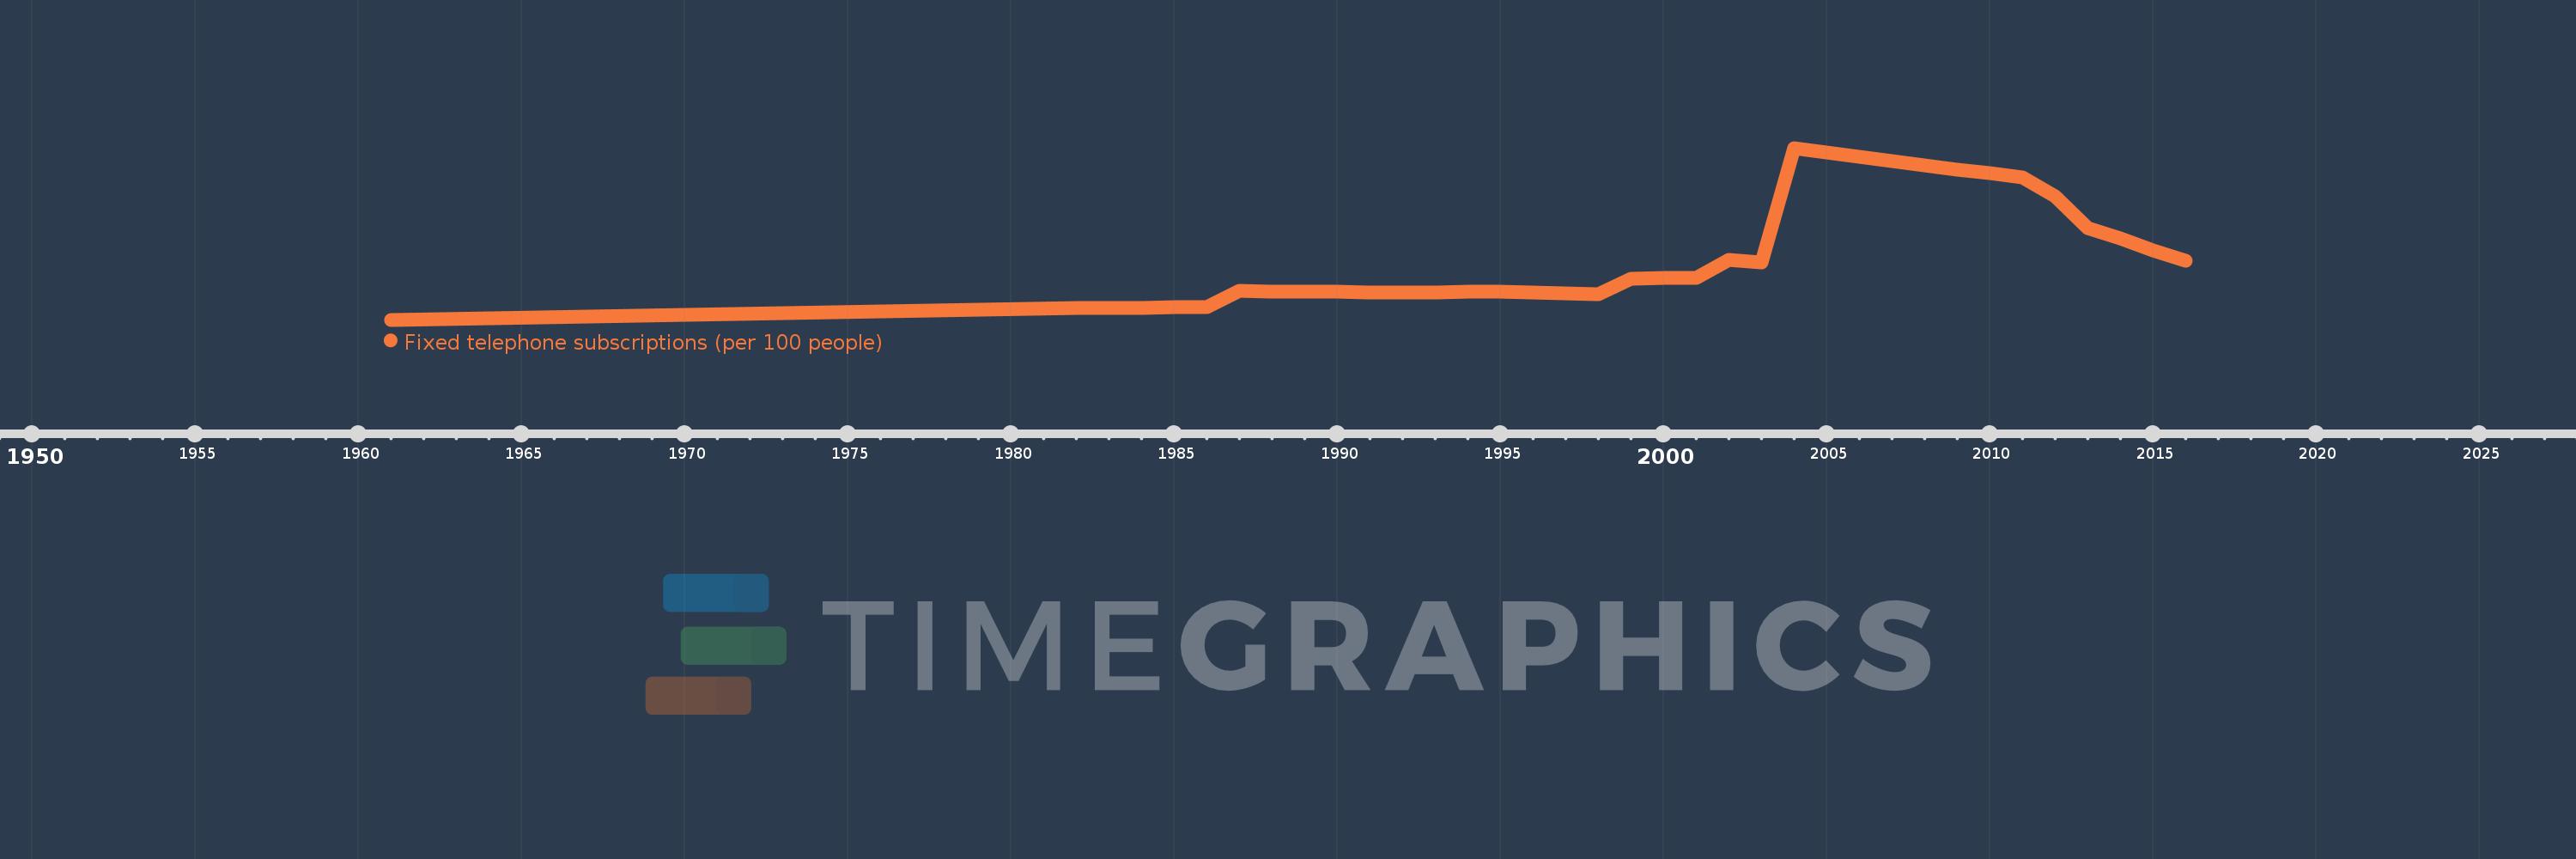
Fixed telephone subscriptions (per 100 people)
2016,2015,2014,2013,2012,2011,2010,2009,2008,2007,2006,2005,2004,2003,2002,2001,2000,1999,1998,1997,1996,1995,1994,1993,1992,1991,1990,1989,1988,1987,1986,1985,1984,1983,1982,1961
This statistics in other country:
AfghanistanAlbaniaAlgeriaAmerican SamoaAndorraAngolaAntigua and BarbudaArab WorldArgentinaArmeniaArubaAustraliaAustriaAzerbaijanBahamas, TheBahrainBangladeshBarbadosBelarusBelgiumBelizeBeninBermudaBhutanBoliviaBosnia and HerzegovinaBotswanaBrazilBritish Virgin IslandsBrunei DarussalamBulgariaBurkina FasoBurundiCabo VerdeCambodiaCameroonCanadaCaribbean small statesCayman IslandsCentral African RepublicCentral Europe and the BalticsChadChileChinaColombiaComorosCongo, Dem. Rep.Congo, Rep.Costa RicaCote d'IvoireCroatiaCubaCuracaoCyprusCzech RepublicDenmarkDjiboutiDominicaDominican RepublicEarly-demographic dividendEast Asia & PacificEast Asia & Pacific (excluding high income)East Asia & Pacific (IDA & IBRD countries)EcuadorEgypt, Arab Rep.El SalvadorEquatorial GuineaEritreaEstoniaEthiopiaEuro areaEurope & Central AsiaEurope & Central Asia (excluding high income)Europe & Central Asia (IDA & IBRD countries)European UnionFaroe IslandsFijiFinlandFragile and conflict affected situationsFranceFrench PolynesiaGabonGambia, TheGeorgiaGermanyGhanaGibraltarGreeceGreenlandGrenadaGuamGuatemalaGuineaGuinea-BissauGuyanaHaitiHeavily indebted poor countries (HIPC)High incomeHondurasHong Kong SAR, ChinaHungaryIBRD onlyIcelandIDA & IBRD totalIDA blendIDA onlyIDA totalIndiaIndonesiaIran, Islamic Rep.IraqIrelandIsraelItalyJamaicaJapanJordanKazakhstanKenyaKiribatiKorea, Dem. People’s Rep.Korea, Rep.KosovoKuwaitKyrgyz RepublicLao PDRLate-demographic dividendLatin America & Caribbean Latin America & Caribbean (excluding high income)Latin America & the Caribbean (IDA & IBRD countries)LatviaLeast developed countries: UN classificationLebanonLesothoLiberiaLibyaLiechtensteinLithuaniaLow & middle incomeLow incomeLower middle incomeLuxembourgMacao SAR, ChinaMacedonia, FYRMadagascarMalawiMalaysiaMaldivesMaliMaltaMarshall IslandsMauritaniaMauritiusMexicoMicronesia, Fed. Sts.Middle East & North AfricaMiddle East & North Africa (excluding high income)Middle East & North Africa (IDA & IBRD countries)Middle incomeMoldovaMonacoMongoliaMontenegroMoroccoMozambiqueMyanmarNamibiaNauruNepalNetherlandsNew CaledoniaNew ZealandNicaraguaNigerNigeriaNorth AmericaNorthern Mariana IslandsNorwayOECD membersOmanOther small statesPacific island small statesPakistanPalauPanamaPapua New GuineaParaguayPeruPhilippinesPolandPortugalPost-demographic dividendPre-demographic dividendPuerto RicoQatarRomaniaRussian FederationRwandaSamoaSan MarinoSao Tome and PrincipeSaudi ArabiaSenegalSerbiaSeychellesSierra LeoneSingaporeSlovak RepublicSloveniaSmall statesSolomon IslandsSomaliaSouth AfricaSouth AsiaSouth Asia (IDA & IBRD)South SudanSpainSri LankaSt. Kitts and NevisSt. LuciaSt. Vincent and the GrenadinesSub-Saharan Africa Sub-Saharan Africa (excluding high income)Sub-Saharan Africa (IDA & IBRD countries)SudanSurinameSwazilandSwedenSwitzerlandSyrian Arab RepublicTajikistanTanzaniaThailandTimor-LesteTogoTongaTrinidad and TobagoTunisiaTurkeyTurkmenistanTurks and Caicos IslandsTuvaluUgandaUkraineUnited Arab EmiratesUnited KingdomUnited StatesUpper middle incomeUruguayUzbekistanVanuatuVenezuela, RBVietnamVirgin Islands (U.S.)West Bank and GazaWorldYemen, Rep.ZambiaZimbabwe Timeline:
This timeline shows a graph from 1961 to 2016 of Somalia. No data until 1960. Number of actual observations by date: 36.
Source name:
World Development Indicators
Source organization:
International Telecommunication Union, World Telecommunication/ICT Development Report and database.
Categories, topics:
Infrastructure
Last updated:
apr 23, 2017
Indicators value changes by year
At the date of observation
Value
Absolute change
Change from previous value
jan 1, 1961
0.045
+0.045
0.0%
jan 1, 1982
0.128
+0.083
182.4%
jan 1, 1983
0.128
0.0
-0.32%
jan 1, 1984
0.129
+0.001
1.16%
jan 1, 1985
0.131
+0.002
1.41%
jan 1, 1986
0.132
+0.001
0.74%
jan 1, 1987
0.247
+0.115
87.06%
jan 1, 1988
0.244
-0.002
-0.92%
jan 1, 1989
0.241
-0.003
-1.26%
jan 1, 1990
0.239
-0.003
-1.08%
jan 1, 1991
0.237
-0.001
-0.57%
jan 1, 1992
0.237
+0.0
0.03%
jan 1, 1993
0.238
+0.001
0.41%
jan 1, 1994
0.239
+0.001
0.4%
jan 1, 1995
0.239
0.0
-0.15%
jan 1, 1996
0.236
-0.003
-1.06%
jan 1, 1997
0.231
-0.005
-2.08%
jan 1, 1998
0.225
-0.007
-2.88%
jan 1, 1999
0.333
+0.108
48.19%
jan 1, 2000
0.336
+0.003
0.79%
jan 1, 2001
0.339
+0.003
0.83%
jan 1, 2002
0.46
+0.121
35.88%
jan 1, 2003
0.447
-0.013
-2.77%
jan 1, 2004
1.244
+0.797
178.19%
jan 1, 2005
1.212
-0.032
-2.57%
jan 1, 2006
1.181
-0.031
-2.56%
jan 1, 2007
1.151
-0.03
-2.54%
jan 1, 2008
1.122
-0.029
-2.5%
jan 1, 2009
1.094
-0.028
-2.51%
jan 1, 2010
1.066
-0.028
-2.56%
jan 1, 2011
1.038
-0.028
-2.65%
jan 1, 2012
0.908
-0.129
-12.47%
jan 1, 2013
0.687
-0.222
-24.41%
jan 1, 2014
0.61
-0.077
-11.19%
jan 1, 2015
0.529
-0.08
-13.19%
jan 1, 2016
0.459
-0.071
-13.38%
Ranking of countries by current statistics by years


Comments: